
Media consumption in Malaysia has shifted structurally. News, entertainment, learning, and shopping no longer live in separate channels. They increasingly happen inside the same platforms, often within the same session.
For marketers, this changes how media should be planned, how creative should be designed, and how performance should be evaluated. Channel labels alone are no longer enough. What matters now is habit, context, and how easily attention turns into action.
In this article, we analyse how Malaysians consume media today using Vase.ai’s first-party survey data. Rather than listing platforms alone, we focus on behaviours that change how marketers plan media, shape creative, and influence purchase decisions.
This article highlights 8 cross-generation insights. The full dataset, including all 24 survey questions, platform comparisons, and verbatims, is available inside the gated dashboard.
Here's What We'll Cover:
-
About This Study
-
🔒 Explore the Full Media Consumption Dashboard
-
1. Facebook, TikTok, Instagram and Youtube Top the List of News Sources
-
2. Most Malaysians Use YouTube, TikTok, and Facebook for Entertainment
-
3. Learning Happens Across Video, Written Content, and Traditional Media
-
4. Platform Usage Is Broad, but Attention Is Concentrated
-
5. Habit Shapes Daily Media Behaviour
-
6. Engagement formats and “comfortable video length” differ by people’s most-used platform
-
7. Media exposure on most-used platform often precedes purchase
-
8. Brand Discovery Happens During Everyday Scrolling
-
Quick Q&A: Malaysia’s Media Habits at a Glance
-
🔒 Go Deeper: Validate Your Media Assumptions
-
Related Media Consumption Topics
About This Study
This analysis is based on Vase.ai’s Media Consumption Across Generations in Malaysia study.
- Total sample size: 962 qualified respondents
- Audience: Malaysians aged 18 and above
- Geography: Malaysia
- Fieldwork period: Responses collected in 6 days
- Methodology: Online survey via Vase.ai’s proprietary panel
- Total survey questions: 24
This article highlights 8 insights only from the study.
The full dataset, including all questions, cross-tabs, and verbatims, lives inside the dashboard.
🔒 Explore the Full Media Consumption Dashboard
The Media Consumption dashboard gives you direct access to:
- Platform usage: news, entertainment, learning, most-used platform, time spent
- Content engagement: content types, video length, reasons for use
- Advertising and purchase: ad attitudes, purchase influence, product categories, spend
- Trends and discovery: brand discovery channels, festive ad reactions, year-on-year change

Note: The dashboard is only accessible via laptop or desktop. You can also view the full list of survey questions to explore how each insight was collected.
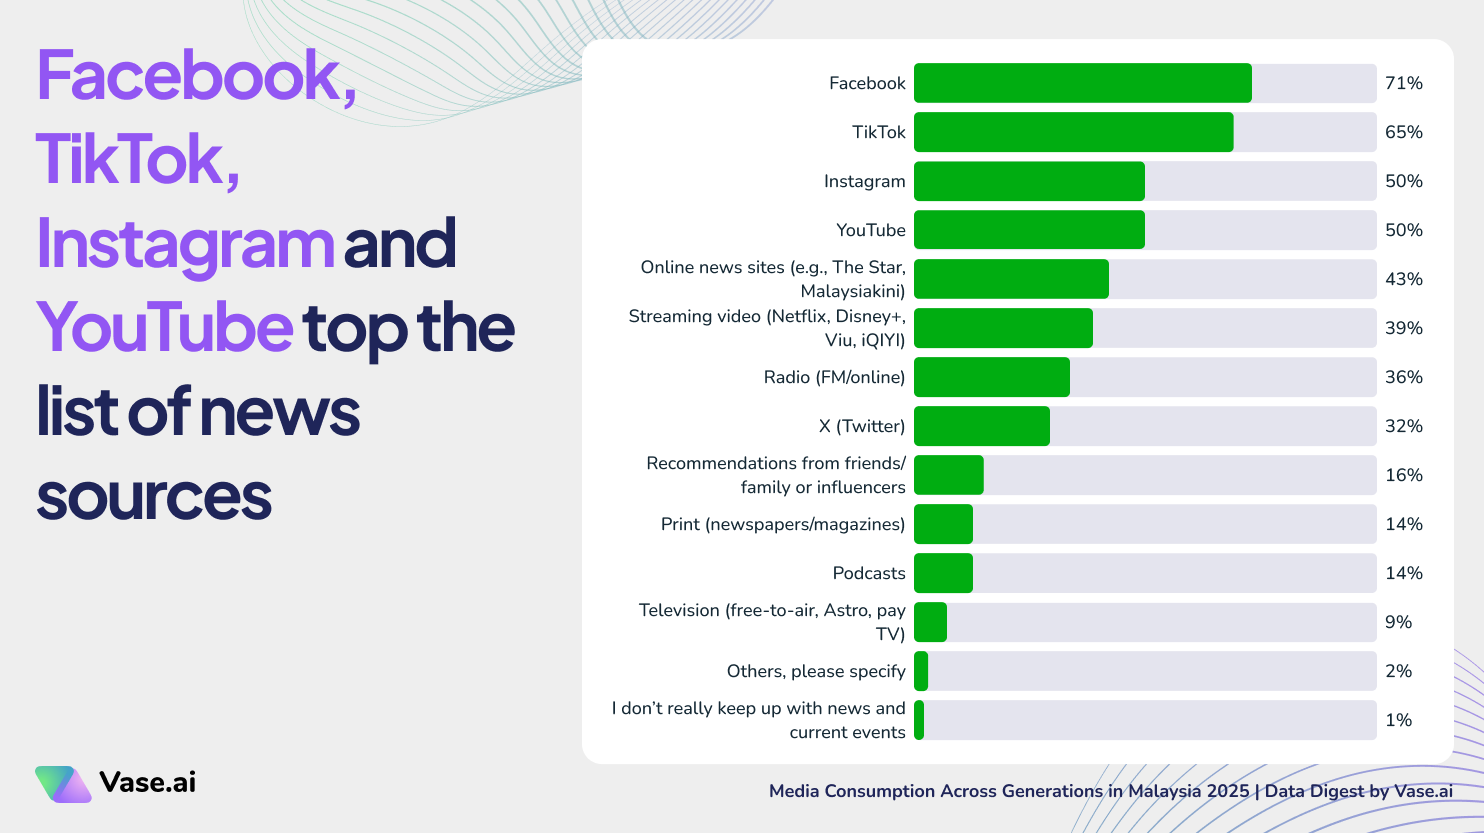
1. Facebook, TikTok, Instagram and Youtube Top the List of News Sources
🗣️ We Asked Malaysians:
“Which platforms do you use most often to keep up with news and current events?”
📊 What the data shows
When asked where they keep up with news, 71% of Malaysians cite Facebook, followed by 65% who use TikTok. Instagram and YouTube are tied at 50%, making social and video platforms the most common sources of everyday news.
🧠 Why this matters to marketers
News discovery is happening inside platforms people already use for everything else (updates, entertainment, creators, communities). Even when the source is still an official news publisher, the experience is shaped by platform behaviour, meaning people encounter news through feeds, recommendations, shares, and subscriptions, not by “going to a news site.
⚡ What marketers can do
-
Plan timely messaging inside social feeds.
-
Design content that fits naturally into scrolling behaviour.
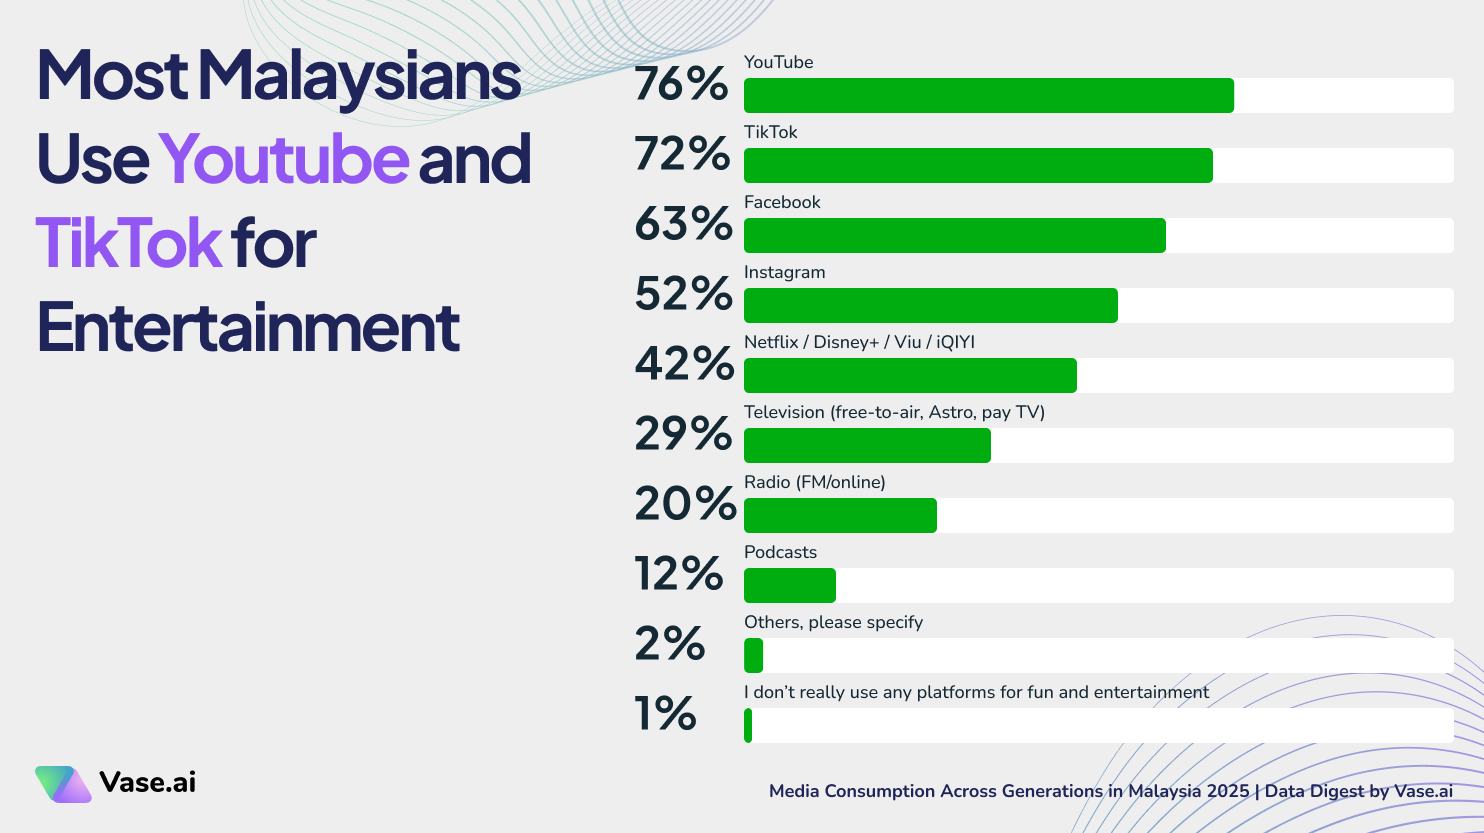
2. Most Malaysians Use YouTube, TikTok, and Facebook for Entertainment
🗣️ We Asked Malaysians:
“Which platforms do you use most often for fun and entertainment (videos, shows, memes, etc.)?”
📊 What the data shows
For entertainment, 76% of Malaysians use YouTube, 72% use TikTok, and 63% use Facebook, showing that leisure media consumption is dominated by video-first platforms.
🧠 Why this matters to marketers
Entertainment attention spans span both quick, casual moments and longer, intentional viewing sessions. Platforms like TikTok are often used for rapid discovery, while YouTube is often where people settle in for deeper viewing. Creative should reflect these different mindsets, instead of treating attention as one consistent behaviour
⚡ What marketers can do
-
Prioritise video-first creative formats.
-
Optimise opening moments for feed-based viewing.
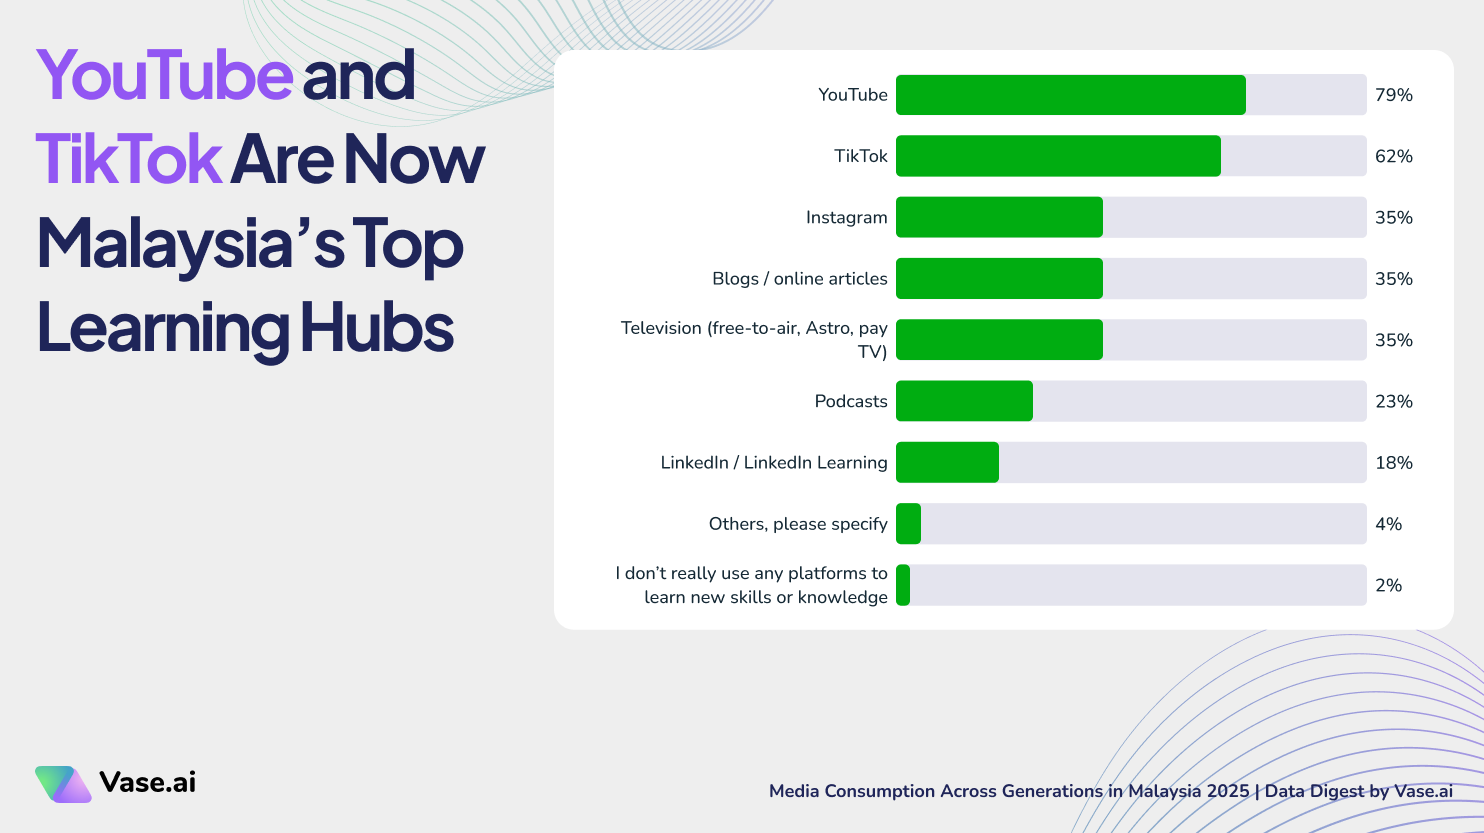
3. Learning Happens Across Video, Written Content, and Traditional Media
🗣️ We Asked Malaysians:
“Which platforms do you use most often to learn new skills or knowledge?”
📊 What the data shows
When learning new skills or knowledge, 79% of respondents turn to YouTube, 62% use TikTok, while 35% report using Instagram, blogs or articles, and television, showing that while video-based social platforms lead, learning behaviour also spans other formats.
🧠 Why this matters to marketers
Learning behaviour is not limited to a single channel. Malaysians use different platforms depending on the topic and the level of detail they want.
⚡ What marketers can do
-
Use video platforms to introduce and explain concepts.
-
Support learning journeys with written content for reference and depth.
-
Use longer formats when clarity and explanation are required.
4. Platform Usage Is Broad, but Attention Is Concentrated
🗣️ We Asked Malaysians:
“Which of the following platforms or media do you currently use at least once a week?”
“Of all the platforms you use, which one do you personally spend the most time on?”
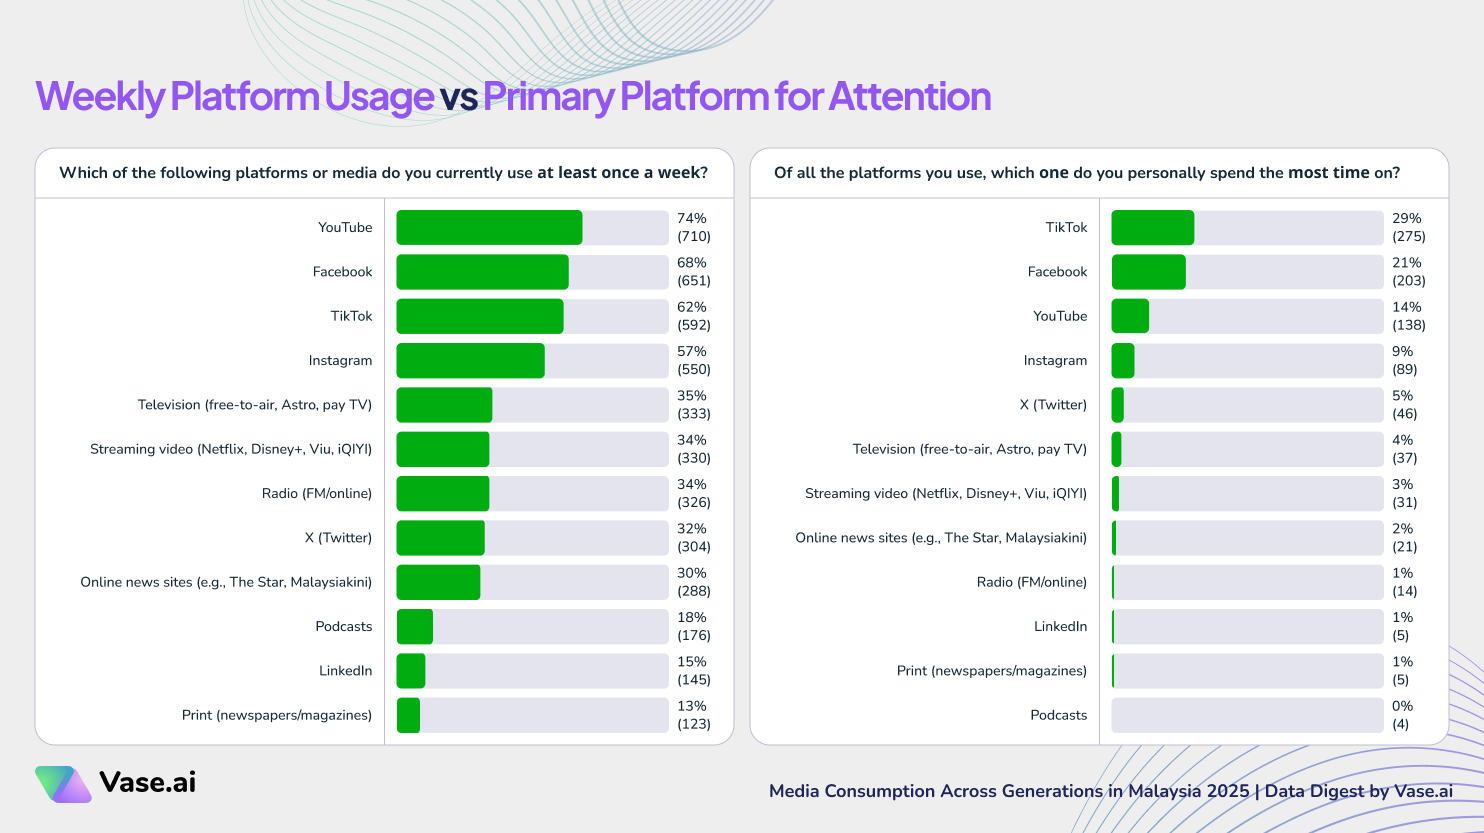
📊 What the data shows
Most Malaysians report using multiple platforms weekly, led by YouTube (74%), Facebook (68%), and TikTok (62%).
However, when asked which single platform they spend the most time on, respondents identify a top time-spent platform: TikTok (29%), followed by Facebook (21%) and YouTube (14%).
What this means: weekly usage is broad, but people still tend to have a #1 platform for time spent (even if the difference versus #2 is small).
🧠 Why this matters to marketers
There are two different planning signals here: Weekly usage tells you where you can build reach across multiple touchpoints.
“Most time spent” tells you which platform is most likely to win more attention relative to the others for a given person (without assuming it takes the majority of their time).
⚡ What marketers can do
-
Plan reach with multi-platform distribution (based on weekly usage).
-
Decide your primary creative home based on the “most time spent” platform, then repurpose for the rest.
-
Avoid over-allocating based on time-spent alone; treat it as a ranking signal, not a proof of overwhelming dominance.
5. Habit Shapes Daily Media Behaviour
🗣️ We Asked Malaysians:
“How many days per week do you use your most-used platform?”
“How much time do you spend on it each day?”
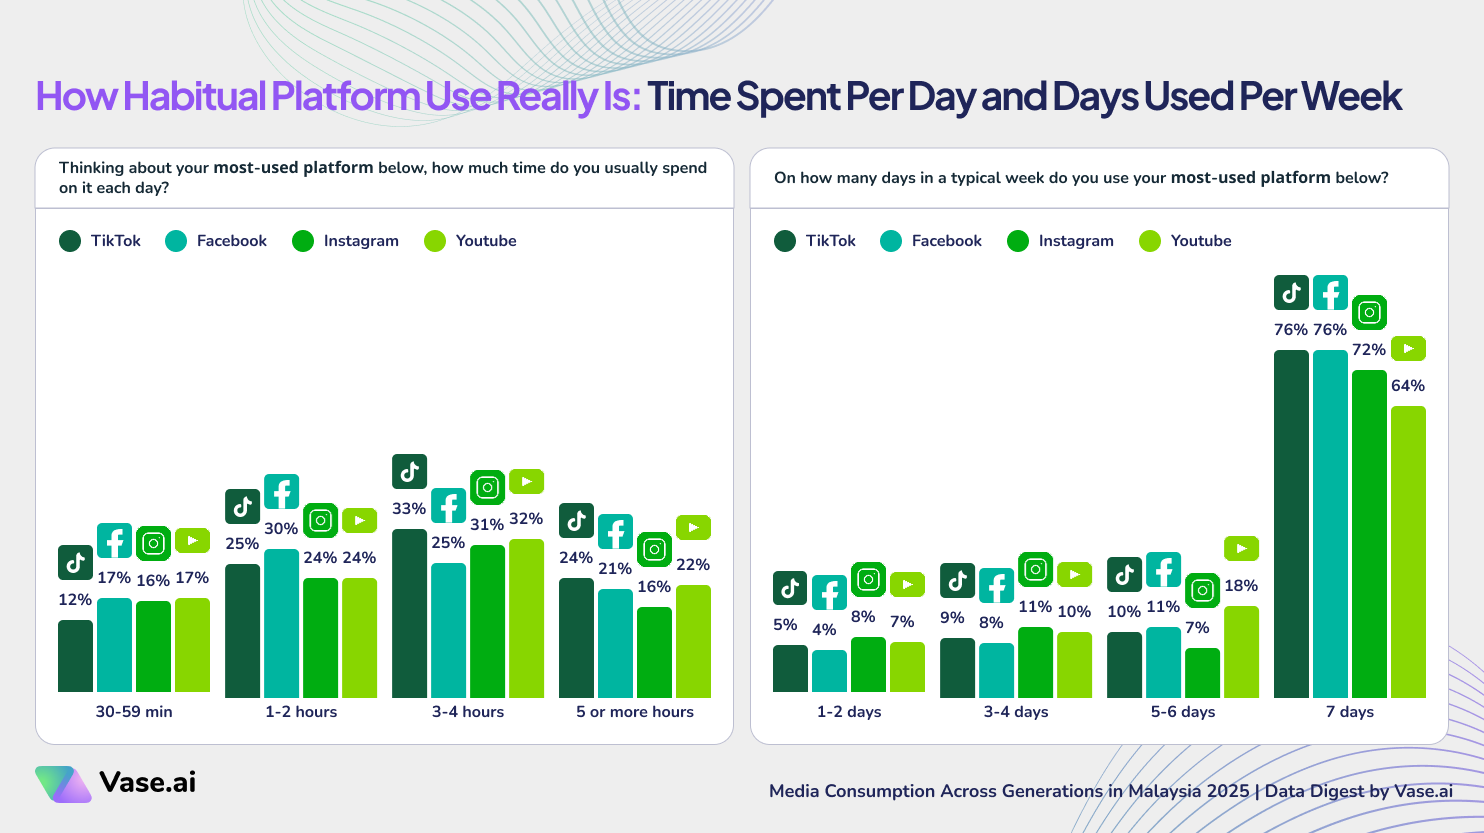
📊 What the data shows
Most-used platforms are used near daily.
- About 80% of respondents use their most-used platform 5 to 7 days a week, including 68% who use it every day (7 days).
Daily time spent varies, with a sizeable heavy-user segment.
- Overall, daily time clusters around 1 to 4 hours (notably 27% at 1–2 hours and 29% at 3–4 hours), with 20% spending 5+ hours on their most-used platform.
Heavy users by most used platform (those who selected the following platforms as the one they use most often):
- TikTok: 57% spend at least 3 hours per day
- YouTube: 54% spend at least 3 hours per day
- Instagram: 47% spend at least 3 hours per day
- Facebook: 45% spend at least 3 hours per day
- *Note: these “3+ hours” figures are not total users of each platform. They reflect heavy users who identified that platform as their most-used platform.
🧠 Why this matters to marketers
This is a heavy-user lens. It helps you understand what “most-used platform” audiences look like in terms of frequency and time spent. For brand planning, this is most useful for designing creative and media that can hold up under repeated exposure, because these users are not occasional visitors.
⚡ What marketers can do
-
Build a heavy-user plan separately from broad reach. Use this insight to guide where repeated exposure is realistic.
-
Rotate creatives and hooks for frequency. Heavy-user audiences will see your message multiple times across the week.
-
Match effort to time-spent environments. Prioritise stronger storytelling and more variations on platforms where 3+ hour users are most common within primary users.
6. Engagement formats and “comfortable video length” differ by people’s most-used platform
🗣️ We Asked Malaysians:
“What type of content do you engage with the most on your most-used platform?”
“What is the maximum length of video you’re comfortable watching fully on your most-used platform?”
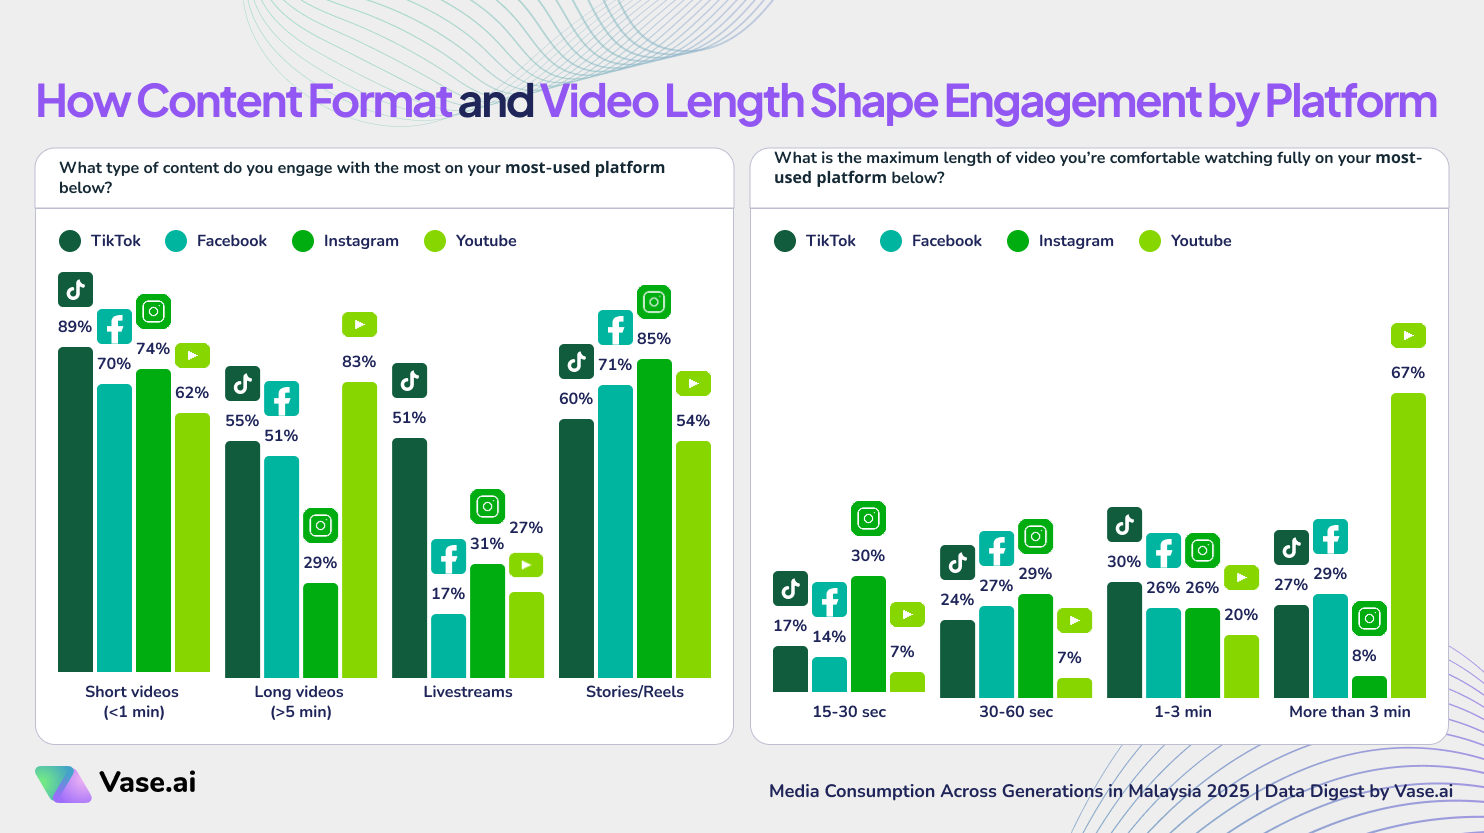
📊 What the data shows
- Among those whose top platform is TikTok, short videos dominate: 89% say they engage most with clips under 1 minute.
When it comes to livestreams, TikTok leads over all other platforms at 51%, while other platforms are 31% and below (Facebook ~27%, YouTube ~27%, Instagram ~17%). - Among those whose top platform is Instagram, Stories/Reels stand out as the strongest engagement format, ahead of other content types.
- Among those whose top platform is YouTube, longer viewing is where it clearly wins: 67% are comfortable watching videos longer than 3 minutes. That’s far ahead of TikTok (~27%), Facebook (~29%), and Instagram (~8%) in the same “3+ minutes” range.
Important context: These numbers reflect behaviour within each platform’s “most-used platform” users (not total Malaysians on each platform).
🧠 Why this matters to marketers
This insight is about engagement behaviour among each platform’s heaviest users, not “intent.” If you’re trying to win attention where people spend the most time, the creative formats that perform best are different: TikTok over-indexes on short video and livestreams, Instagram is strongest for Stories/Reels-style engagement, and YouTube is the clearest environment for 3+ minute viewing.
⚡ What marketers can do
-
Create multiple creative cuts of the same campaign asset (for example: <15s, 15–60s, 1–3 min, 3+ min) so you’re not force-fitting one edit everywhere.
-
Use TikTok for fast hooks and short-form impact, and consider livestream-led formats when your category benefits from demos, Q&A, or creator-style selling.
-
Use YouTube when you need more explanation time (product walkthroughs, comparisons, how-it-works), because 3+ minute comfort is much higher among its primary users.
7. Media exposure on most-used platform often precedes purchase
🗣️ We Asked Malaysians:
“Have you ever purchased a product or service after seeing it on your most-used platform?”
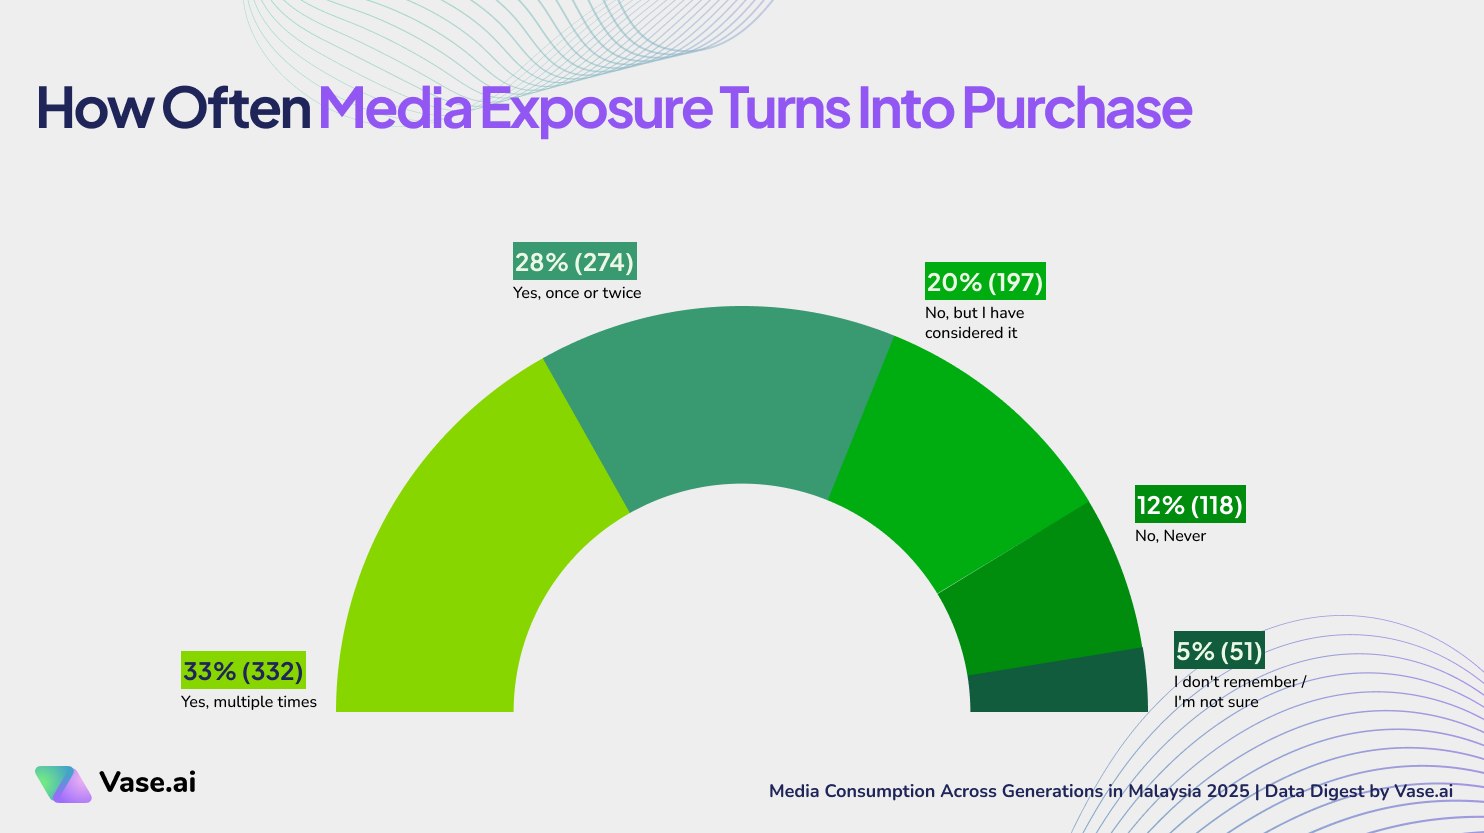
📊 What the data shows
Media exposure on respondents’ most-used platform likely to precede purchase.
33% of respondents report purchasing products multiple times after seeing them on their most-used platform, while another 28% have done so once or twice.
Only 12% say they have never purchased after seeing a product or service on their most-used platform.
Important context: This question only tells us whether a purchase happened after exposure on their most-used platform. It does not tell us whether the purchase happened on the platform.
🧠 Why this matters to marketers
This result supports one clear takeaway: for many Malaysians, their most-used platform is a high-impact influence point in the path to purchase. It’s where they spend the most time, repeatedly encounter products, and are more likely to act on what they’ve seen over time.
⚡ What marketers can do
-
Prioritise your audience’s most-used platform for product exposure, since it’s where repeat influence is most likely to happen.
-
Make the creative immediately decision-useful: what it is, why it matters, and what to do next (without assuming where checkout happens).
8. Brand Discovery Happens During Everyday Scrolling
🗣️ We Asked Malaysians:
“Where do you usually come across new brands or products for the first time?”
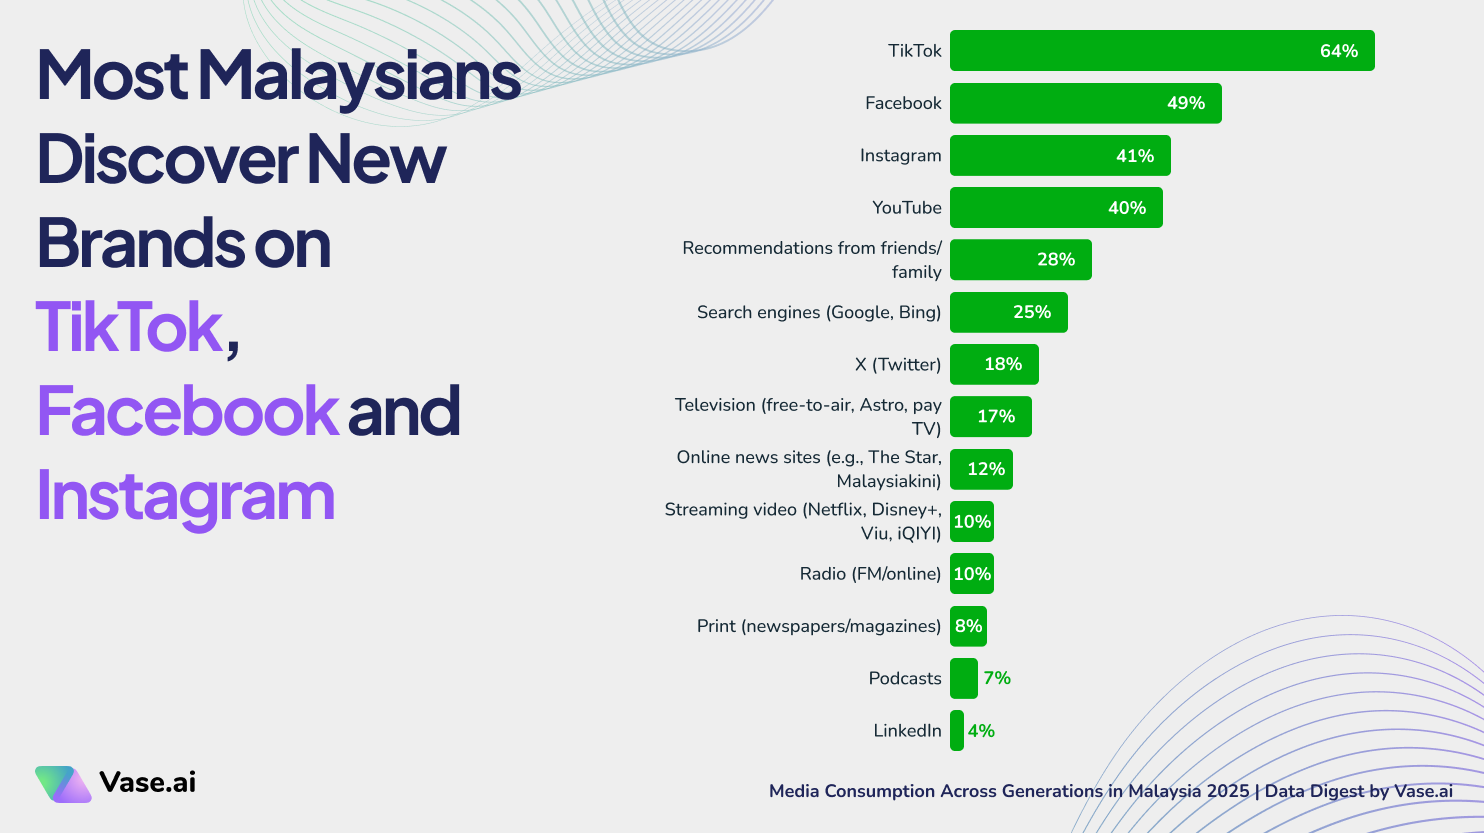
📊 What the data shows
Brand discovery most often occurs on TikTok (64%), followed by Facebook (49%) and Instagram (41%), platforms that are also among the most frequently used.
🧠 Why this matters to marketers
Brand discovery now happens during routine scrolling rather than active search.
⚡ What marketers can do
-
Invest in discovery formats on high-frequency platforms.
-
Plan discovery earlier in the funnel.
-
Design creative for passive exposure.
Quick Q&A: Malaysia’s Media Habits at a Glance
🔒 Go Deeper: Validate Your Media Assumptions
Want to explore every question and chart in detail?
This dashboard is based on Vase.ai’s survey of 962 Malaysians, collected in 6 days.
Note: The dashboard is only accessible via laptop or desktop. You can also view the full list of survey questions to explore how each insight was collected.
Related Media Consumption Topics