
Vase.ai Consumer Insights | Adults in Indonesia | N=200 | Fieldwork February 2026
Indonesians are still picking up new platforms, and buying from them is already normal. Here is what each platform is actually used for, and where brands get found.
71% of Indonesians have bought something after seeing it on the platform they use most. In the Singapore edition of this study, the same question came back at 33%.
That changes what the media question is. It is not whether social sells in Indonesia. It is which platform does which job, because the platform people spend the most time on is not the one with the widest reach, and the place people first meet a brand is not the place they go to learn about it.
Here is what 200 adults in Indonesia told us, and what it means for a media plan.
Here's What We'll Cover:
- 📋 About This Study
- 1. 📱 Know the Indonesian Media User
- 2. 📊 The Bottom Line: Five Findings
- 3. 🔁 Chapter 1: New Platforms, More Hours
- 4. 🛒 Chapter 2: Buying Is Already the Norm
- 5. 🎬 Chapter 3: Every Platform Is Used for a Different Job
- 6. 🧭 Chapter 4: Where Brands Get Found, and Who Finds Them Where
- 7. 🎊 Chapter 5: Festive Moments
- 8. 🎯 Recommendations
- 🔒 Go Deeper: Filter the Full Dataset by Platform, Discovery and Spend
📋 About this study Show more ▾
This report is based on a survey of 200 adults in Indonesia aged 18 to 69, conducted in February 2026 on Vase.ai's Indonesian respondent database. It was not commissioned by any brand, platform, or media owner. The analysis is independent.
It measures what people say they do and what they remember buying. One thing to keep in mind while reading: each person first named the single platform they spend the most time on, and a whole block of questions then asked only about that one platform, not about every platform they use. How long they spend on it, what they watch there, how they feel about its ads, and what they have bought after seeing it there are all answers about that one platform. Where a figure comes from that block, we say which group it describes and how many people are in it. It does not replace ad platform data or sales data.
The sample is close to gender balanced, 52% women and 48% men, and spread across four age bands from 18 to 69. It leans toward Java, where 74% of respondents live, and 39% are in Greater Jakarta. 199 of the 200 answered in Indonesian. The data is unweighted. With 200 people, the figures show the shape of the market rather than exact percentages.
📱 Section 1
Know the Indonesian media user
Short answer: Reach and time pull in opposite directions. YouTube has the widest weekly reach at 73%, but when people name the one platform they spend the most time on, TikTok wins at 25% and YouTube drops to 17%.
|
71%
🛒 have bought after seeing something on their main platform
|
62%
🔍 first come across new brands on TikTok
|
25%
⏱️ name TikTok as the platform they spend the most time on
|
52%
✨ picked up a new online platform in the last year
|
Weekly use versus main platform:
| Platform | % who use it weekly | % who say it is the one platform they spend the most time on |
|---|---|---|
| 📺 YouTube | 73% | 17% |
| 72% | 14% | |
| 70% | 15% | |
| 🎵 TikTok | 63% | 25% |
| 53% | 6% | |
| ✖️ X (Twitter) | 38% | 5% |
| 🛍️ Shopee | 36% | 2% |
| ✈️ Telegram | 34% | 2% |
| 🍿 Streaming services | 29% | 2% |
| 📰 Online news sites | 29% | 1% |
| 📻 Television | 24% | 1% |
Weekly use: 198 people answered. Main platform: 194 people answered. The right-hand column adds to 90%, not 100%, because four answers are not shown as rows: 7% named a platform under "Other", 3% were not sure, 1% named LinkedIn and 1% named radio.
Reach and time are not the same thing. TikTok is only fourth on weekly reach at 63%, behind YouTube, Instagram and WhatsApp, yet it takes the largest share of deepest time at 25%. YouTube is the mirror image: widest reach at 73%, but only 17% call it their main platform.
Whichever platform they pick, they are on it constantly. Of the 48 people who name TikTok as the platform they spend the most time on, 79% use it seven days a week and 77% spend three hours or more a day on it. Of the 30 who name WhatsApp, 87% are on it every day.
📊 Section 2
The Bottom Line
Spend figure is based on the 140 buyers who told us their largest purchase of this kind.
- Buying is the norm, not the exception. 71% have bought something after seeing it on their main platform: 36% once or twice and 35% several times. Only 11% say they never have.
- How heavily someone uses media does not separate the buyers. We split people into two groups by the time they spend on their main platform each day. Three hours or more a day bought at 75%, under three hours bought at 71%. Those two numbers are close enough that we would not call it a real difference, and the same is true of whether their media use is growing.
- The mix is still moving. 52% started using a new online platform in the last year and 45% say they spend more time on media than they did. Only 9% say less.
- Discovery is commerce led. TikTok is named as a first-discovery source by 62% and Shopee by 53%, ahead of Instagram at 45% and YouTube at 36%. Only 6% say they do not look out for new brands at all.
- The platforms do different jobs. YouTube leads learning at 81%. TikTok leads entertainment at 73%. Instagram leads news at 68%, narrowly ahead of YouTube at 67% and TikTok at 65%.
New platforms, more hours
Short answer: Unlike Singapore, Indonesia's platform mix has not settled. Half the market picked up something new in the last year, and more people are giving media extra hours than are cutting back.
What changed about the platforms you use (N=200):
Figures rounded, so they total slightly over 100%.
What changed about how much media you use (N=200):
Figures rounded, so they total slightly over 100%.
Put the two together and the direction is one way. 87% are either holding steady or using more media than last year. We did not measure time platform by platform, so we cannot say which platform absorbed the extra hours.
This is the opposite of what the same study found in Singapore, where 64% were on exactly the same platforms as a year earlier. In Indonesia only 42% say that.
A channel audit you ran a year ago is probably out of date, because half your audience has added something since. That does not mean chase every new platform. It means rebuild the channel list on a shorter cycle than you would for a settled market, and check weekly reach before you assume where your audience is.
Buying is already the norm
Short answer: 71% have bought something after seeing it on their main platform. Because almost everyone buys, how heavily someone uses media tells you nothing about who to target.
Have you bought anything after seeing it on your main platform? (N=200)
Figures rounded, so they total slightly over 100%.
Most media plans assume heavy users are the best prospects. In Indonesia that split does not exist, because the base rate is already high. We split everyone who named a main platform into two groups only, by how long they spend on it each day.
Have bought, by time spent on their main platform:
Have bought, by how their media use has changed:
Only 17 people said they use less media, so read that bottom bar as an indication rather than a firm number.
None of those gaps is wide enough that we would call it a real difference. Being a heavy user, or a growing user, is not a buying signal here. It is not that intensity works differently in Indonesia, it is that there is almost no non-buying group left to separate it from.
What buyers bought (base: the 141 people who had bought):
People could name more than one category, so these do not add to 100%. Excludes 5% who chose "Other" and 1% who were not sure.
The largest single purchase of this kind (base: the 140 buyers who answered):
Was that purchase in line with what they normally spend? (base: the 136 buyers who answered)
What buyers said made them buy, in their own words (base: the 141 people who had bought):
Open-text answers, grouped afterwards. One answer could fall into more than one group, so these do not add to 100%.
Open-text answers were in Indonesian. Three, quoted as written, with a translation: "biasanya karena banyak pengikut atau banyaknya Komen positif yang ditinggalkan membuat saya sering mempertimbangkan untuk membeli suatu produk" (usually because there are a lot of followers or a lot of positive comments left, which makes me often consider buying a product). "Jika produk dalam konten memiliki tampilan yang menarik atau sesuatu yang sedang saya butuhkan saat itu juga." (if the product in the content looks appealing or is something I need right at that moment). "saya sering menggunakan tiktok karena voucher nya menggoda" (I often use TikTok because the vouchers are tempting).
Do not build the plan around finding buyers, because most of your audience already is one. Build it around being present at the moment of relevance and giving people something to check: reviews, a visible price, a reason it fits. And plan for a basket in the low hundreds of thousands of rupiah, because that is where the money actually lands.
Every platform is used for a different job
Short answer: The same person goes to different platforms for different things. Instagram and YouTube for news, TikTok for entertainment, YouTube for learning. The lengths and the ad tolerance change with them.
Which platforms people use most often for each job (N=200):
| Job | Most used | Second | Third |
|---|---|---|---|
| 📰 News and current events | Instagram 68% | YouTube 67% | TikTok 65% |
| 🍿 Fun and entertainment | TikTok 73% | YouTube 72% | Instagram 65% |
| 🎓 Learning a new skill | YouTube 81% | TikTok 52% | Instagram 40% |
News is the tightest race on the page. Instagram, YouTube and TikTok are separated by three points, and television is still named by 50%, so a news-adjacent buy is not a social-only decision. Learning is the opposite: YouTube breaks away at 81%, with online course platforms at 24% and LinkedIn at 15%.
The routed data says the same thing. Of the 33 people who name YouTube as the platform they spend the most time on, 85% say learning something new is a reason they use it. Of the 48 who name TikTok, 83% say entertainment, and discovering new products and learning new tips both sit at 63%.
How long people will watch a video, by the platform they use most:
| If the platform they use most is... | Then |
|---|---|
| 📺 YouTube (n=33) | 67% will watch a video longer than 3 minutes |
| 🎵 TikTok (n=48) | 35% will go past 3 minutes, but 42% stop at a minute or less |
| 📸 Instagram (n=27) | 41% sit at 1 to 3 minutes, and only 11% go past 3 minutes |
| 💬 WhatsApp (n=30) | 40% stop at 15 to 30 seconds, the shortest of the four |
These four groups are small, between 27 and 48 people, so treat the percentages as a rough guide rather than exact numbers. They describe only the people who named that platform as the one they use most, not everyone who uses it, and they exclude people whose main platform is television, streaming or radio, who were not asked this question.
How people feel about ads on their main platform:
| If the platform they use most is... | Then |
|---|---|
| 📺 YouTube (n=33) | 61% pay attention if the ad is relevant, 12% usually skip |
| 🎵 TikTok (n=48) | 31% often discover things they end up buying, 35% pay attention if relevant, 17% usually skip |
| 📸 Instagram (n=27) | 44% usually skip or ignore ads, 22% pay attention if relevant |
| 💬 WhatsApp (n=30) | 40% usually skip, 37% pay attention if relevant |
That last column is how people describe their own attitude to advertising. It is not a measure of how many sales ads actually cause, so please do not use it as one.
Cutting one film into four sizes is not the same as making four assets. A demonstration or explainer belongs on YouTube, where the regulars will actually watch it and 61% say they pay attention when it is relevant. Anything on Instagram has to land inside a minute and survive an audience where 44% say they skip ads. TikTok is the only one of the four where a meaningful share, 31%, describe ads as something they buy from, which is why the shoppable format belongs there.
Where brands get found, and who finds them where
Short answer: Discovery is led by TikTok at 62% and Shopee at 53%. Which route someone takes splits sharply by gender, and that split holds after accounting for age and how many boxes people tick.
Where people first come across new brands (N=200):
People could name more than one source, so these do not add to 100%. Sources named by fewer than 13% are not shown: online news sites 10%, streaming 6%, Telegram 4%, podcasts 4%, print 3%, LinkedIn 2%, radio 2%, and 2% not sure.
A marketplace sitting second, above Instagram and YouTube, is the finding a Malaysian or Singaporean plan would not predict. Shopee is not only where the transaction closes in Indonesia, it is where more people meet the brand than meet it on YouTube.
Discovery route by gender
| Source | Women (n=104) | Men (n=96) |
|---|---|---|
| 🎵 TikTok | 68% | 54% |
| 🛍️ Shopee | 62% | 44% |
| 📺 YouTube | 25% | 48% |
| 17% | 36% | |
| 46% | 44% |
All four of those gaps hold up when you account for age and for the fact that some people simply tick more boxes on every question. Instagram is the control case: it is the same for both.
What buyers bought, by gender
| Category | Women (n=76) | Men (n=65) |
|---|---|---|
| 👗 Fashion, apparel and shoes | 75% | 71% |
| 💄 Beauty and personal care | 74% | 48% |
| 🛒 Groceries, food and drink | 53% | 45% |
| 📱 Electronics and gadgets | 22% | 57% |
| 🛋️ Home and furnishing | 41% | 26% |
| ✈️ Travel and experiences | 13% | 14% |
Base: the people of each gender who had bought something after seeing it on their main platform. People could name more than one category.
Beauty and electronics move in opposite directions and both gaps are wide. Fashion is where the two meet, at 75% and 71%, close enough that we would not call it a difference.
Route the media before you rewrite the message. The evidence for a different channel mix by gender is strong, and there is nothing here saying the proposition itself needs to change, because we did not test message variants. In practice that means a beauty or fashion launch weights TikTok and Shopee, while an electronics launch keeps real weight on YouTube and Facebook.
Festive moments
Short answer: Festive advertising gets more than passive exposure here. 31% say they actively engage with it, and another 26% pay attention without interacting.
How people react to festive ads across Ramadan and Lebaran, Independence Day and Christmas or New Year (N=200):
Figures rounded, so they total slightly over 100%.
Only 5% say they skip festive ads outright, and only 7% say they do not see them at all. That is a smaller wall of avoidance than the same people describe for everyday advertising on their main platform, where 44% of Instagram regulars and 40% of WhatsApp regulars say they usually skip.
A festive burst here has permission to ask for something, a comment, a share, a click, rather than settling for a view. Judge it on engagement rather than reach, and set the benchmark against your own non-festive work on the same platform, since people clearly treat the two differently.
🎯 Section 3
Recommendations
Findings are the payload; these are the principles they support, each with what to measure.
📐 For marketers and media planners
Shopee is where 53% of Indonesians say they first come across new brands, second only to TikTok at 62% and ahead of Instagram at 45%. Measure: first-source brand discovery by platform, with marketplace media budgeted and reported separately from performance spend.
52% picked up a new online platform in the last year and only 42% are on the same set as before. Measure: weekly reach of your audience on each platform, refreshed at least twice a year.
YouTube has the widest weekly reach at 73% but only 17% call it their main platform. TikTok is fourth on reach at 63% and first on main-platform share at 25%. Measure: both weekly reach and share of main-platform mentions, never reach alone.
Women first meet brands on TikTok at 68% and Shopee at 62%. Men do so on YouTube at 48% and Facebook at 36%. Measure: cost per discovery by platform, split by audience, rather than a single blended figure.
✍️ For creative and content teams
67% of the people who use YouTube most will watch past three minutes. 40% of the people who use WhatsApp most stop at 30 seconds. Measure: completion rate against the length ceiling for each platform, not one blended completion rate.
YouTube leads learning at 81%, and 85% of the people who use it most say learning something new is a reason they are there. Measure: view-through and assisted conversion on explainer creative, held separately from short-form.
31% actively engage with festive ads and another 26% pay attention without interacting, so an interaction ask is realistic here. Measure: engagement rate on festive creative against your non-festive baseline on the same platform.
🛍️ For e-commerce and performance teams
55% of buyers put their largest purchase of this kind between Rp 100.000 and Rp 499.999, and 59% said it was within their usual spending range. Volume will move before order value does. Measure: average order value against the Rp 500.000 line, and the share of orders that clear it.
When buyers explained the purchase in their own words, product relevance (24%) and reviews or ratings (11%) came up alongside promotions (21%). Measure: conversion on creative that shows reviews, ratings or the product in use, against creative that does not.
Filter all 200 responses by platform, where people find new brands, and how much they spend. See the numbers behind every finding in this report.
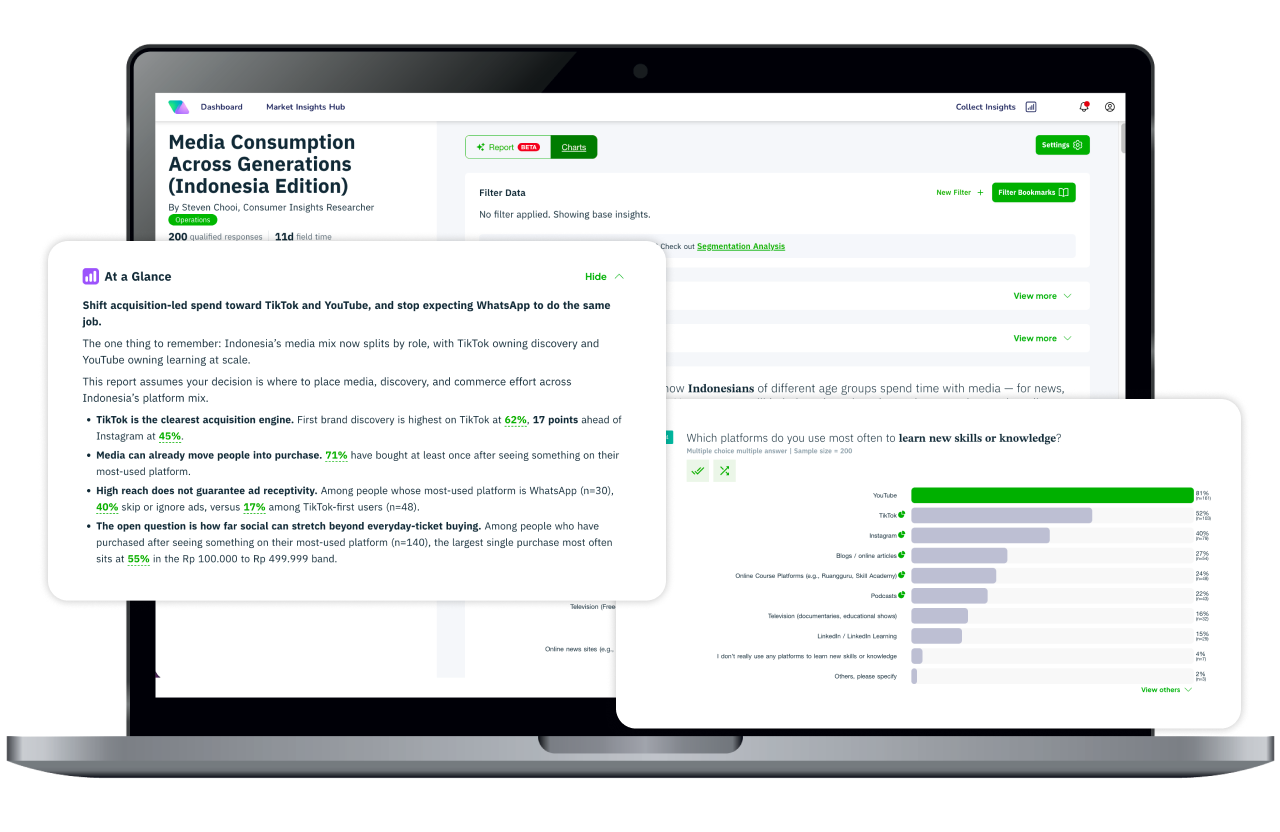
Note: The dashboard is best viewed on laptop or desktop.
Frequently asked questions