
Vase.ai Consumer Insights | Adults in Singapore | N=200 | Fieldwork February 2026
Singaporeans are using the same platforms as last year, and most are spending as much time with media or more. Here is what each platform is actually used for, and what actually leads to a purchase.
64% of Singaporeans are on exactly the same platforms as last year. 79% are holding steady or using more media than before, and only 10% are cutting back.
That part is easy to measure. The harder question is which of those hours lead to someone buying something. It turns out the number of hours a day people spend on their favourite app tells you almost nothing. Whether their media use is growing tells you a lot.
Here is what 200 adults in Singapore told us, and what it means for a media plan.
Here's What We'll Cover:
- 📋 About This Study
- 1. 📱 Know the Singapore Media User
- 2. 📊 The Bottom Line: Five Findings
- 3. 🔁 Chapter 1: More Hours, Same Apps
- 4. 🧭 Chapter 2: What Actually Leads to a Sale
- 5. 🎬 Chapter 3: Every Platform Is Used for a Different Job
- 6. 🛒 Chapter 4: What People Actually Buy
- 7. 🎯 Recommendations
- 🔒 Go Deeper: Filter the Full Dataset by Platform, Discovery and Spend
📋 About this study Show more ▾
This report is based on a survey of 200 adults in Singapore aged 19 to 77, conducted in February 2026 on Vase.ai's Singapore respondent database. It was not commissioned by any brand, platform, or media owner. The analysis is independent.
It measures what people say they do and what they remember buying: which platforms they use each week, which single one takes up the most of their time, what they use each one for, and what they have bought after seeing it. It does not replace ad platform data or sales data. It is the layer those tools cannot see, the reason behind the behaviour.
The ethnic mix of the 200 people surveyed closely matches Singapore's resident population as reported by the Department of Statistics. The main difference is age: people aged 65 and over are 13% here against roughly 19% of residents. The data is unweighted. With 200 people, the figures show the shape of the market rather than exact percentages, and we report the total audience throughout rather than splitting it into smaller groups.
📱 Section 1
Know the Singapore media user
Short answer: Most people use several platforms every week, but only one of them takes up most of their day. 76% use YouTube weekly. But when asked to name the one platform they spend the most time on, YouTube came top with only 24%.
|
76%
📺 use YouTube weekly
|
64%
🔁 on the same platforms as last year
|
72%
⏱️ spend an hour or more a day on their main app
|
33%
🛒 have bought after seeing something on a platform
|
Weekly use versus main platform:
| Platform | % who use it weekly | % who say it is the one platform they spend the most time on |
|---|---|---|
| 📺 YouTube | 76% | 24% |
| 58% | 14% | |
| 57% | 13% | |
| 📰 Online news sites | 46% | 1% |
| 📻 Television | 43% | 9% |
| 🎵 TikTok | 42% | 15% |
| 🍿 Streaming services | 40% | 9% |
| ✈️ Telegram | 36% | 4% |
Weekly use: 196 people answered. Main platform: 195 people answered.
Reach and time are not the same thing. Look at Facebook and TikTok side by side. Facebook is used weekly by more people (57% against 42%), but fewer people name it as their main platform (13% against 15%). When people pick just one platform, no platform gets more than a quarter. There is no dominant platform in Singapore, only a widest one.
Whichever platform they pick, they are on it constantly. Of the 187 people who named a main platform and answered, 72% spend an hour or more on it every day and 71% use it seven days a week.
📊 Section 2
The Bottom Line
- The growth is in hours, not in new platforms. 64% are on the same platforms as last year and only 22% picked up a new one, while 34% say they use more media and 10% say less.
- Hours per day on one app do not predict buying. People spending an hour or more a day on their main platform bought at 36%, against 30% for lighter users. Those two numbers are close enough that we would not call it a real difference.
- Whether someone's media use is growing does predict buying. 45% of people using more media than last year have bought something they saw on a platform, against 32% of those using about the same and 20% of those using less.
- Each platform is used for a different job. For news people go to online news sites (61%) and TV (46%). For entertainment they go to YouTube (68%). For learning a skill they go to YouTube again (58%).
- When media does sell something, it is usually cheap and familiar. Of the 33% who had bought, 42% spent under S$100, and 53% said the purchase was in line with what they normally spend.
More hours, same apps
Short answer: People did not move to new platforms this year. They spent longer on the ones they already had.
Did Singaporeans change what they use? Barely. We asked what had changed about the platforms they use compared with a year ago, and 64% said nothing had.
What changed about the platforms you use (N=200):
What changed about how much media you use (N=200):
Figures rounded, so they total slightly over 100%.
Put the two charts together and the picture is clear. People are not switching platforms, and 79% are either holding steady or using more media than last year. Only 10% are cutting back. We did not measure time platform by platform, so we cannot say which of their platforms absorbed the extra hours.
Your audience's platform mix is stable, which means a channel audit does not go out of date quickly. It does not mean your brand should avoid new channels. If your audience already uses a platform weekly and you are not there, that gap is still worth closing. What the data says is narrower: you are not chasing an audience that keeps moving, so you can plan against a settled picture.
What actually leads to a sale
Short answer: How many hours a day someone spends on their favourite app tells you almost nothing about whether they buy. Whether their media use is growing tells you much more.
Most media plans assume heavy users are the best prospects. This data does not support that.
Have bought something they saw on a platform, by time spent on their main app:
Those two numbers are close enough that we would not call it a real difference. Being a heavy user of one app is not, on its own, a buying signal.
Have bought something they saw on a platform, by how their media use has changed:
Only 20 people said they use less media, so read that bottom bar as an indication rather than a firm number.
Every step down the ladder points the same way, and the gap between the top and bottom bars is wide enough that we would not put it down to chance.
- It is a pattern, not proof of cause. Growing media use may be a symptom of being in an active shopping phase rather than a cause of buying.
- It is about direction, not volume. The comparison that works is whether someone's media use is rising or falling. The comparison that does not work is how many hours they spend.
Heavy users of a single platform are not automatically your best prospects. The signal worth watching is direction: the 34% whose media use is growing bought at 45%, against 20% among the 10% whose use is shrinking. That growing group is smaller than your whole target, so treat it as a tilt in how you weight spend rather than a replacement audience.
Every platform is used for a different job
Short answer: The same person uses different platforms for different things. For news they go to news sites and TV. For entertainment and for learning a skill, they go to YouTube.
We asked which platforms people use most often for three different jobs. The ranking changes every time.
Which platforms people use most often for each job (N=200):
| Job | Most used | Second | Third |
|---|---|---|---|
| 📰 News and current events | Online news sites 61% | Television 46% | YouTube 42% |
| 🍿 Fun and entertainment | YouTube 68% | Instagram 46% | TikTok 41% |
| 🎓 Learning a skill | YouTube 58% | Government portals 30% | Professional platforms 28% |
YouTube is the only platform in the top three for all three jobs, which is what makes it useful when you want to reach a lot of people. It is also why knowing it has the widest reach does not tell you whether it suits your message.
News is the clearest case. Online news sites and TV are still named more often than any social platform, so if you want your brand to appear alongside news, social feeds are not where most people are getting it. Learning works differently: a general video platform sits alongside specialists, with MySkillsFuture and Gov.sg named by 30%.
Where people first come across new brands (N=200):
People could name more than one source, so these do not add to 100%.
No single source gets you anywhere near half the market. And 22% say they do not look out for new brands at all.
How long people will watch a video, by the platform they use most:
| If the platform they use most is... | Then |
|---|---|
| 📺 YouTube (n=47) | 72% watch a video longer than 3 minutes |
| 🎵 TikTok (n=29) | 45% stop at 30 to 60 seconds, only 31% go past a minute |
| 📸 Instagram (n=27) | 78% stop at 60 seconds or less |
| 👥 Facebook (n=25) | 36% sit at 1 to 3 minutes, the most mixed of the four |
These four groups are small, between 25 and 47 people, so treat the percentages as a rough guide rather than exact numbers. They describe only the people who named that platform as the one they use most, not everyone who uses it, and they exclude people whose main platform is TV, streaming or radio, who were not asked this question.
Cutting one video into four sizes is not the same as making four videos that suit four platforms. A longer explainer suits YouTube. Anything meant to prove a product works needs to land inside a minute on TikTok and Instagram. Anything meant to run alongside news still belongs on news sites and TV, because that is where people say they go for it.
What people actually buy
Short answer: A third have bought something after seeing it on a platform. Most of what they bought cost under S$100 and was in line with what they normally spend.
Have you bought anything after seeing it on your main platform? (N=200)
Figures rounded, so they total slightly over 100%.
So a third have bought and a third never have. The 23% who considered it and did not buy sit in between, and they are the group worth thinking about: they got close enough to weigh it up.
What buyers bought (base: the 65 people who had bought):
What buyers spent. Among the 62 buyers who told us their largest purchase of this kind, 42% spent under S$100 and 31% spent between S$100 and S$299. Among the 60 who compared it with their normal spending, 53% said it was in line with what they usually spend, 32% said a little more than usual, and 7% called it a one-off splurge.
How people feel about ads on their main platform (base: the 160 who answered):
Excludes 1% who chose "Other".
That last figure is how people describe their own attitude to advertising. It is not a measure of how many sales ads actually cause, so please do not use it as one.
How people react to festive ads across Chinese New Year, Hari Raya, Deepavali and Christmas (N=200):
Figures rounded, so they total slightly over 100%.
Only about one in ten does anything you could count as engagement, so judging festive work on clicks will make it look weaker than it is.
What buyers said made them buy. We asked the 65 buyers to describe it in their own words, then grouped the answers. The most common were the content itself being influential (23%), being interested or engaged by it (18%), seeing what the product does and how it is used (18%), advertising (17%), and reviews or recommendations (14%). Seeing something repeatedly was mentioned by 8%.
One person described the whole sequence: "I will be influence to buy a product if I see a relevant ad that shows the product in an interesting way. I will buy the product if I see a good unboxing video by a buyer." Another was shorter: "Showcasing the product and it's usage" (quoted as written, typo included). A third said, "It keeps appearing on my feed".
Plan for small baskets. And when buyers explained the purchase in their own words, the most common answers were about the content itself doing the work, with showing the product in use the clearest single reason they gave.
🎯 Section 4
Recommendations
Findings are the payload; these are the principles they support, each with what to measure.
📐 For marketers and media planners
45% of people using more media than last year have bought something they saw on a platform, against 32% of those using about the same. Hours per day on one app predicted nothing. Measure: whether your target's media use is rising, rather than how many hours they log.
Facebook is used weekly by more people than TikTok (57% against 42%), but fewer people name it as their main platform (13% against 15%). Measure: both weekly reach and share of main-platform mentions, never reach alone.
64% are on the same platforms as last year, so your channel audit will stay accurate for a while. If your audience already uses a platform weekly and you are not on it, that is still a gap worth closing. Measure: weekly reach of your audience on each platform against where your budget currently sits.
✍️ For creative and content teams
72% of the people who use YouTube most will watch past three minutes. 78% of the people who use Instagram most stop at 60 seconds or less. Measure: completion rate against the length ceiling for each platform.
Seeing what the product does and how it is used was named by 18% of buyers without being prompted, alongside reviews at 14%. Measure: conversion on creative that demonstrates the product against creative that does not.
🛍️ For e-commerce and performance teams
42% of buyers spent under S$100 and 53% stayed in line with their normal spending, so volume will move before order value does. The 23% who considered it and did not buy are already interested. Measure: how many of the people who considered go on to buy, separately from your overall conversion rate.
🎯 Section 4
Recommendations
Findings are the payload; these are the principles they support, each with what to measure.
📐 For marketers and media planners
45% of people using more media than last year have bought something they saw on a platform, against 32% of those using about the same. Hours per day on one app predicted nothing. Measure: whether your target's media use is rising, rather than how many hours they log.
Facebook is used weekly by more people than TikTok (57% against 42%), but fewer people name it as their main platform (13% against 15%). Measure: both weekly reach and share of main-platform mentions, never reach alone.
64% are on the same platforms as last year, so your channel audit will stay accurate for a while. If your audience already uses a platform weekly and you are not on it, that is still a gap worth closing. Measure: weekly reach of your audience on each platform against where your budget currently sits.
✍️ For creative and content teams
72% of the people who use YouTube most will watch past three minutes. 78% of the people who use Instagram most stop at 60 seconds or less. Measure: completion rate against the length ceiling for each platform.
Seeing what the product does and how it is used was named by 18% of buyers without being prompted, alongside reviews at 14%. Measure: conversion on creative that demonstrates the product against creative that does not.
🛍️ For e-commerce and performance teams
42% of buyers spent under S$100 and 53% stayed in line with their normal spending, so volume will move before order value does. The 23% who considered it and did not buy are already interested. Measure: how many of the people who considered go on to buy, separately from your overall conversion rate.
Filter all 200 responses by platform, where people find new brands, and how much they spend. See the numbers behind every finding in this report.
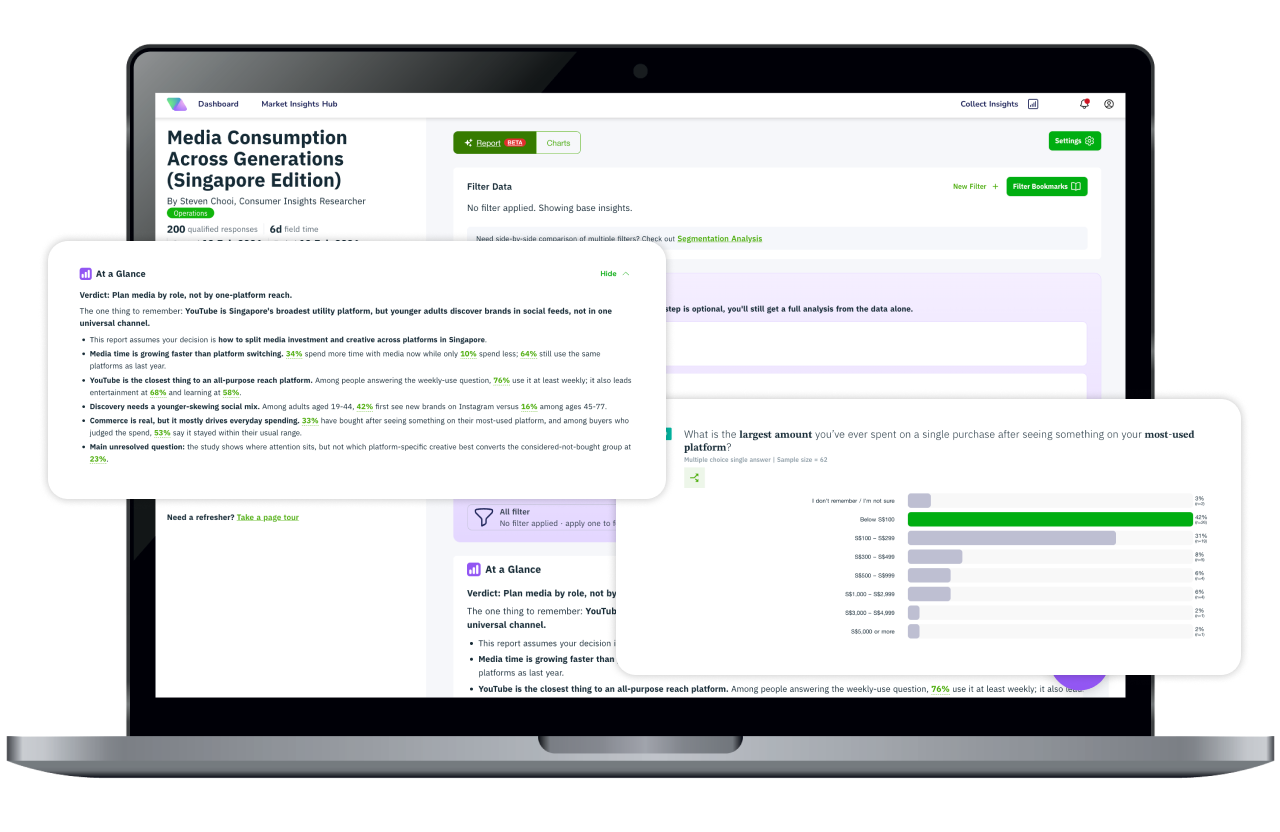
Note: The dashboard is best viewed on laptop or desktop.
Frequently asked questions