
Quick answer: The best Indonesia FMCG insight platform is the one that gets you from raw responses to a clear decision fastest without losing nuance. Compare platforms on how they handle Bahasa Indonesia open-ended answers, how easily you can cut results by region, channel and city tier, whether significance testing is built in, and who helps you interpret the findings. Data collection matters, but the insight layer is where most Indonesia projects slow down.
Most comparisons of Indonesia research platforms focus on fieldwork: how many consumers they can reach, which islands they cover and how fast a survey fills. Those questions matter, and we cover them in our comparisons by research job and by channel and region fit.
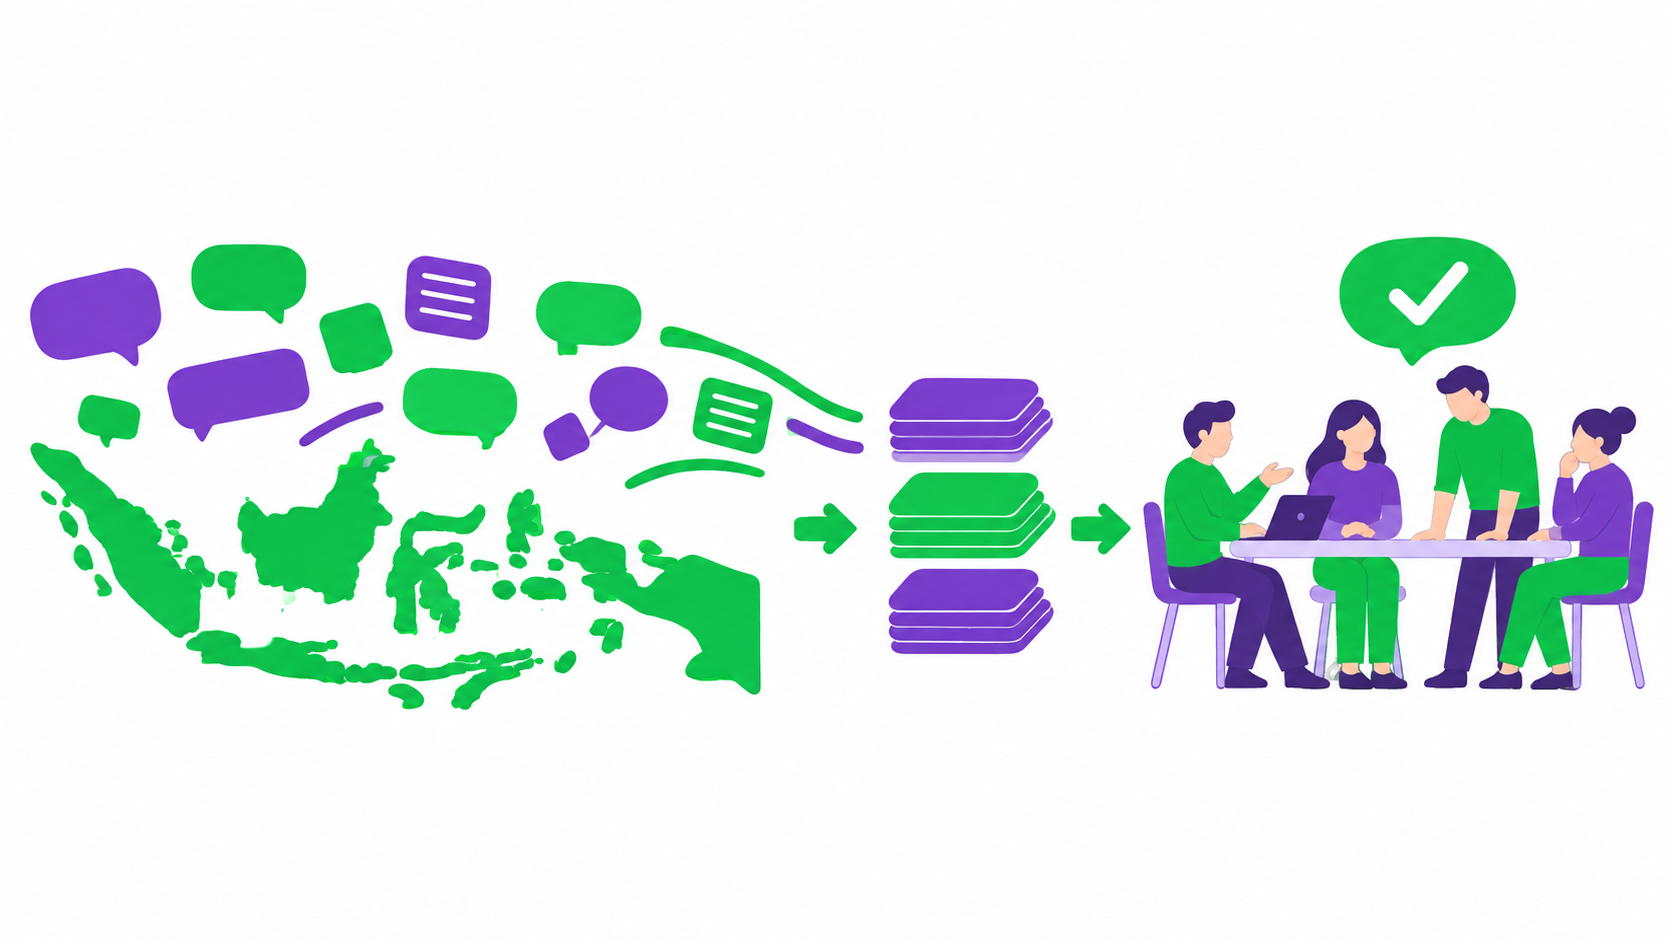
This guide looks at what happens after the data arrives. For FMCG teams in Indonesia, the slowest part of a project is often not fieldwork but the days spent cleaning, coding, cutting and explaining the results. An insight platform should shorten that part.
Why is the insight step harder in Indonesia?
Indonesia is one of the most varied consumer markets in the world, and that variety shows up in the data.
- Language. Open-ended answers arrive in Bahasa Indonesia, often mixed with regional languages, slang and English brand names. Coding them consistently takes skill.
- Geography. Results from Greater Jakarta can look very different from Java outside Jakarta, Sumatra or Eastern Indonesia. A national average can hide the story.
- Channel. Shoppers who buy mainly in warung and traditional trade behave differently from minimarket and modern trade shoppers, and both differ from e-commerce buyers.
- Brand landscape. Strong local and regional brands sit alongside multinationals, so brand lists and competitive reads need local knowledge.
A platform that handles collection well but leaves you to untangle all of this manually will slow your decisions.
What should you compare in an insight platform?
Use these six criteria when you compare providers. They focus on the journey from raw responses to a recommendation your team can act on.
| Criterion | What good looks like | Question to ask the provider |
|---|---|---|
| Open-ended coding | Bahasa Indonesia answers grouped into clear themes, with example verbatims you can check | How are local-language open-ends coded, and can I see the original answers? |
| Cuts and filters | Results by region, city tier, channel, age and SES without waiting for new tables | Can my team build new cuts ourselves? |
| Significance testing | Differences flagged only when they are statistically meaningful | How do you show which differences are real? |
| Speed to first read | Results visible while fieldwork is still running | When can I see the first data? |
| Interpretation support | A researcher who knows Indonesian consumers can help explain the findings | Who helps me turn results into a recommendation? |
| Output formats | Dashboard, data tables and slides that suit your internal process | What exactly do I receive at the end? |
How do the main provider types compare on insight?
Indonesia FMCG teams usually choose from a handful of provider types. On the insight step, they differ more than you might expect.
| Provider type | Examples | Insight strengths | Insight gaps to plan for |
|---|---|---|---|
| Global full-service agencies | Ipsos, Kantar, NielsenIQ | Experienced analysts, polished reporting, retail and category context | Reporting cycles can be longer than tactical decisions allow |
| DIY survey software | Qualtrics, SurveyMonkey | Flexible analysis tools for teams with in-house analysts | Local-language coding and interpretation sit with you |
| Sample providers | Dynata, Cint | Access to respondents across markets | Usually deliver raw data, so analysis is a separate step |
| Regional research platforms | Milieu Insight, Vase.ai | Built-in dashboards and local consumer understanding | Check how much expert support is included for your study |
| Audience profiling data | GWI | Broad context on media and attitudes | Not designed to answer custom product questions |
Many teams use more than one. A common pattern is an agency for the annual brand tracker and a faster platform for tactical tests on packs, claims and promotions, where the insight needs to arrive within days. If you want to see what those tactical tests look like in practice, start with the test type you run most often and judge the insight output on that.
What does good insight output look like?
A worked example shows the difference. Imagine an instant beverage brand testing two new flavour names across Indonesia.
A raw-data approach delivers a spreadsheet of answers. Someone exports it, translates the open-ends, builds tables for each region and writes a summary. The team sees results a week or more after fieldwork closes.
An insight-led approach shows a live dashboard while responses come in. Open-ended reasons are already grouped into themes such as "sounds refreshing", "sounds too sweet" and "sounds like a children's drink", with Bahasa Indonesia verbatims available to check the coding. The team filters by region and sees that one name performs strongly in Java but weakly in Sumatra, and the dashboard flags that the gap is statistically significant. Before reading too much into smaller regional groups, the team checks the base sizes, as explained in our guide on whether a difference in your results is real.
The decision becomes a regional naming choice rather than a single national winner, and it is made in the same week.
How should you run a fair comparison?
A short pilot is the most reliable way to compare insight platforms.
- Pick one live question, such as a pack or claim test you need to run anyway.
- Define the cuts you will need in advance: region, channel, SES, age and any user groups.
- Include at least two open-ended questions in Bahasa Indonesia to test coding quality.
- Time each step: first data visible, full results ready and recommendation agreed.
- Ask a brand manager, not only the insights team, to read the output and say whether they could act on it.
The platform that wins is usually the one that removes the most manual steps between the last response and the decision meeting.
Where does Vase.ai fit?
We build Vase.ai so FMCG teams can move from fieldwork to findings without a long manual step in between. Surveys reach a verified panel of Southeast Asian consumers, responses are AI-validated, and results appear on a real-time dashboard with filters, open-ended themes and significance flags.
Teams choose how they work: run the study DIY on the platform, or bring in our in-house research experts to design the questionnaire, plan the cuts and write the full research report. Either way, the workflow is built for fast turnaround, so insight lands while the decision is still open.
Frequently asked questions
What is an insight platform in market research?
An insight platform combines data collection with the tools to analyse and interpret it, such as dashboards, open-ended coding, filters and significance testing, so teams can reach conclusions without exporting data to separate tools.
How should Bahasa Indonesia open-ended answers be analysed?
They should be coded into themes by people or tools that understand Bahasa Indonesia and local slang, with original verbatims kept so the team can check that each theme reflects what consumers actually said.
Which cuts matter most for Indonesia FMCG research?
Region, city tier, channel, socio-economic group and age are the most common. The right set depends on your distribution and your target consumer, so agree the cuts before fieldwork starts.