
Quick answer: A difference in survey results is real, rather than noise, when it is statistically significant: large enough, given the base sizes, that it is unlikely to have happened by chance. Check the base size of each group, look for a significance flag at the 95 percent confidence level, and be most cautious with small groups and many comparisons. Then ask whether the difference is big enough to matter for the decision.
Why do survey results move even when nothing has changed?
Every survey measures a sample, not the whole population. If you ran the same survey twice with two different samples of the same people, you would get slightly different numbers each time. That natural wobble is sampling error. It is why a brand score can rise or fall a few points from one wave to the next without anything real happening in the market.
Brand teams ask us about this all the time, usually when a result lands and someone in the room wants to act on a small change. The question 'is this real?' is the right one to ask, and there is a straightforward way to answer it.
What does statistically significant actually mean?
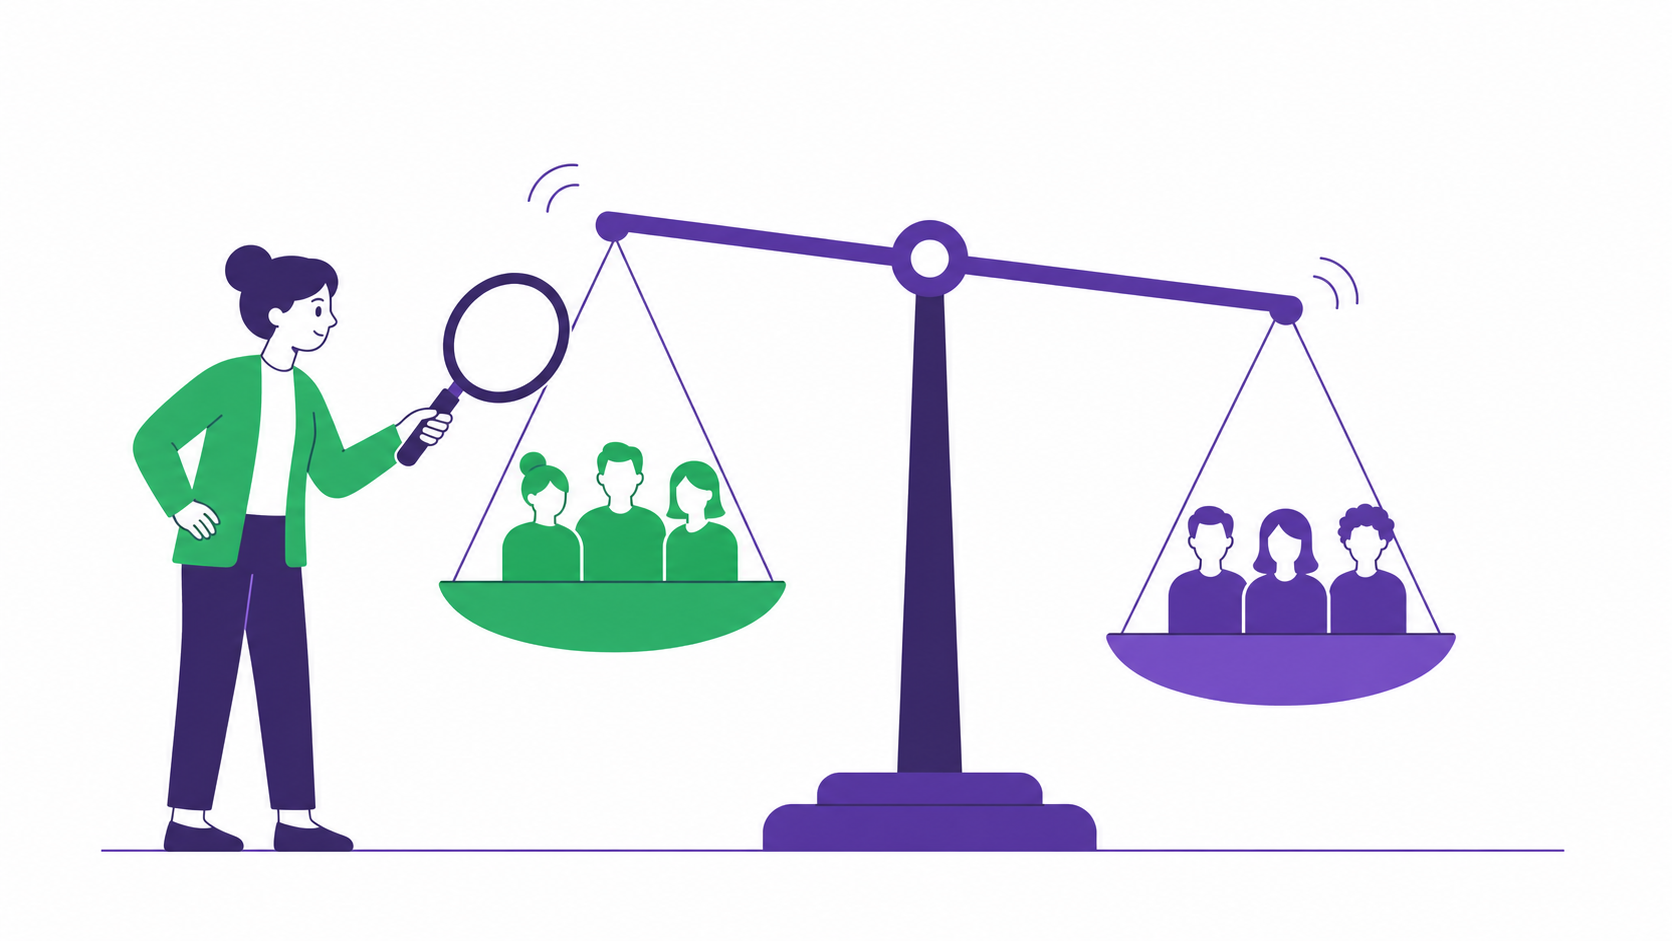
A difference is statistically significant when it is large enough, compared with the expected sampling wobble, that it is unlikely to be due to chance. The usual research norm is the 95 percent confidence level, meaning that if there were truly no difference, a gap this large would appear by chance only rarely.
Two things drive whether a difference is significant: its size and the base sizes behind it. A large difference between small groups may not be significant, while a small difference between very large groups can be. That is why the same few points can be meaningful in one study and noise in another.
How do base sizes change what you can trust?
| Base size per group | How to treat differences | Typical use |
|---|---|---|
| Under 50 | Indicative only, avoid firm conclusions | Directional reads on niche groups |
| Around 100 | Only larger gaps will be significant | Minimum for reporting a subgroup |
| A few hundred | Moderate gaps become reliable | Main audience or key segments |
| Large national samples | Even small gaps can be significant | Trackers and total market reads |
These are working norms, not fixed rules. Our survey sample size guide explains how to choose a base for your own study.
What should you check before acting on a difference?
- Look at the bases. Check how many people sit behind each number, not just the total sample.
- Find the significance flag. Most dashboards and data tables mark significant differences with a letter, arrow or colour. Learn which test your provider uses.
- Watch for multiple comparisons. If you compare twenty subgroups, one or two will look significant by chance alone. Treat isolated surprises with care.
- Check consistency. A real shift usually shows up in related measures too. If awareness rose, did consideration move as well?
- Compare over time. In trackers, a change that holds for two or three waves is far more convincing than a single jump.
- Ask if it matters. A significant difference can still be too small to change the decision.
What does this look like in a real decision?
Suppose a tracker shows consideration for your brand rising from one wave to the next, and the marketing team wants to credit a new campaign. Before anyone celebrates, check three things. First, the base: if the wave has a few hundred respondents, a small rise may sit inside the margin of error. Second, the flag: does the dashboard mark the change as significant? Third, the pattern: did awareness and ad recall move too, among the audience the campaign targeted?
If the change is significant, consistent with related measures and concentrated where the campaign ran, you have a credible story. If it is not significant and nothing else moved, the honest reading is 'no clear change yet', and the next wave will tell you more. The same logic applies when comparing two concepts in a test, or two consumer groups in a usage study.
Writing down this reasoning in the results summary also helps stakeholders who were not in the room understand why the team acted, or chose to wait.
What are the most common mistakes?
- Treating every movement in a tracker as news, and changing strategy because of noise.
- Ignoring significance flags because the chart looks convincing.
- Cutting the data so finely that every group is too small to read.
- Comparing results from different sample sources as if they were the same study.
- Confusing statistical significance with business importance.
A good habit is to agree, before results arrive, what size of difference would change your decision. This keeps the discussion focused on what matters and stops small movements from taking over the meeting. For the wider checks worth running on any results deck, see what consumer goods teams should check in research reports.
Where does Vase.ai fit?
We build Vase.ai for quantitative consumer surveys on a verified panel of Southeast Asian consumers, with AI-validated responses and a real-time dashboard for exploring results. Teams can work DIY or have our research experts help design the sample and interpret what is and is not significant.
If you are deciding how many people to survey in the first place, our survey sample size guide is the natural next read, because good significance testing starts with the right base.
Frequently asked questions
What is a margin of error?
It is the range around a survey result within which the true population value is likely to sit. Larger samples have smaller margins of error, so their results are more precise.
Does a significant result mean the finding is important?
No. Significance only tells you the difference is unlikely to be chance. Whether it matters depends on its size and on the decision you need to make.
Can I test significance myself?
Yes. Many survey dashboards flag significant differences automatically, and spreadsheet tools can run basic tests. For complex designs, such as weighted data or many subgroups, ask a researcher to check.