
Vase.ai Consumer Insights | Adults in Vietnam | N=200 | Fieldwork February 2026
Four platforms reach almost the same people in Vietnam, and they are used for almost all of the same things. Reach will not separate your media plan here. What people say they have already bought will.
71% of the adults we surveyed in Vietnam said they had bought something after seeing it on the platform they spend the most time on. 12% said they never had.
The second thing the survey found is more awkward for a media plan. Facebook, YouTube and Zalo reach a similar share of people each week. Facebook and YouTube are named at similar rates for news. YouTube Shorts, Facebook Reels and TikTok are named at similar rates for entertainment. Facebook, TikTok and YouTube are named at similar rates as the place people first come across a new brand. On most of the jobs we asked about, the leading platforms are too close together to separate.
That leaves two things that genuinely do separate, and one commercial fact that matters more than either. This report covers all three.
Here's What We'll Cover:
- 📋 About This Study
- 1. 📱 Know the Vietnam Media User
- 2. 📊 The Bottom Line: Five Findings
- 3. 🎯 Chapter 1: The Same Platforms Do Every Job
- 4. 🛒 Chapter 2: Feeds Already Sell, and They Sell Everyday Things
- 5. 🔄 Chapter 3: What People Say Has Changed Since a Year Earlier
- 6. 🎯 Recommendations
- 🔒 Go Deeper: Filter the Full Dataset by Platform, Discovery and Spend
📋 About this study Show more ▾
This report is based on a survey of 200 adults in Vietnam aged 18 to 74, conducted in February 2026 on Vase.ai's Vietnamese respondent database and answered in Vietnamese. Vase.ai designed, funded and ran it. It was not commissioned by any brand, platform or media owner. Only completed, qualified responses are included.
One thing to keep in mind while reading. Each person first named the single platform they spend the most time on, and a block of questions then asked only about that one platform, not about every platform they use. How long they spend on it, how long a video they will watch there, how they feel about its ads and what they have bought after seeing it there are all answers about that one platform. Where a figure comes from that block, we say which group it describes and how many people are in it.
The sample is 51% women, with a median age of 37, and spread across Northern (38%), Central (24%) and Southern Vietnam (39%). The figures are unweighted, so read them as the shape of the market rather than exact percentages. With 200 people we report the whole market and do not break the findings down by age, gender, generation, income or region: at this sample size those groups get too small to be reliable.
📱 Section 1
Know the Vietnam media user
Short answer: Four platforms carry this market. Facebook, YouTube and Zalo are used weekly by a similar share of people, and TikTok by fewer. Facebook is the one clear winner on time: 39% named it as the single platform they spend the most time on, against 20% for YouTube.
|
71%
🛒 say they have bought after seeing something on their main platform
|
81%
👥 say they use Facebook at least once a week
|
39%
⏱️ name Facebook as the platform they spend the most time on
|
70%
📅 use their main platform seven days a week
|
Weekly use versus main platform:
| Platform | % who say they use it weekly | % who say it is the one platform they spend the most time on |
|---|---|---|
| 81% | 39% | |
| 📺 YouTube | 77% | 20% |
| 💬 Zalo | 74% | 14% |
| 🎵 TikTok | 59% | 18% |
| 📻 Television | 37% | 4% |
| 📰 Online news sites | 37% | 0% |
| 🍿 Streaming services | 28% | 2% |
| 27% | 0% | |
| ✖️ X (Twitter) | 15% | 1% |
| 🎧 Podcasts | 11% | 1% |
| 11% | 0% | |
| 📻 Radio | 9% | 1% |
| 8% | 1% |
Weekly use was a multiple-choice question, so that column does not add to 100%. A further 2% chose "not sure" instead of naming a platform. The main-platform question was single choice; 1% were not sure and 1% named something outside the list.
Base: all respondents for weekly use; the 196 who named a main platform for the right-hand column (n=200). Fieldwork February 2026. Source: Vase.ai.
Reach does not separate the top three. Facebook at 81%, YouTube at 77% and Zalo at 74% are close enough that a sample this size cannot tell them apart, so treat them as one tier. TikTok at 59% sits clearly below them, and television at 37% clearly below that.
Time is where a real gap opens. 39% named Facebook as the one platform they spend the most time on, well clear of YouTube at 20%. TikTok at 18% and Zalo at 14% are close to YouTube and to each other. Vietnam does have a biggest platform. It just shows up in time, not in reach.
How long people say they spend on their main platform each day
Base: the 193 people who named a main platform and said how long they spend on it (n=193). Fieldwork February 2026. Source: Vase.ai.
Whichever platform they pick, they are on it constantly. 47% said three hours or more a day, adding the top two bands together, and 70% said they use that platform seven days a week.
📊 Section 2
The Bottom Line
The five numbers that matter
Each bar comes from a different question. The full answer list for each is in the chapter it belongs to.
Base: all respondents, except the spend figure, which is based on the 140 buyers who stated their largest purchase (n=200). Fieldwork February 2026. Source: Vase.ai.
- Buying from a feed is normal in Vietnam. 39% said once or twice and 32% said several times, close enough to read as one group. 12% said never, and 14% said they considered it and did not.
- Reach does not separate the top platforms. Facebook 81%, YouTube 77% and Zalo 74% weekly are too close to call apart at this sample size. The same is true for news, for entertainment and for where people first meet a brand.
- Two things do separate. Facebook is clearly ahead on time (39% name it as their main platform against 20% for YouTube), and YouTube is clearly ahead for learning a skill (77% against 55% for Facebook Groups).
- The basket is everyday sized. 44% of buyers put their largest purchase of this kind in the 500,000 to 1,499,999 VND band, and 62% of those who compared it said it was within their usual spending range.
- Festive advertising earns a response. 37% said they actively engage with festive ads, clearly more than the 22% who pay attention without interacting. Only 5% said they usually skip them.
The same platforms do every job
Short answer: We asked which platforms people use most often for news, for entertainment and for learning a skill. The names at the top barely change, and on two of the three jobs the leaders are too close to separate. Only learning has a clear specialist.
Which platforms people use most often for each job (N=200):
| Job | Named most often | Then | Then | Then |
|---|---|---|---|---|
| 📰 News and current events | Facebook 78% | YouTube 69% | TikTok 55% | Online news sites 50% |
| 🍿 Fun and entertainment | YouTube Shorts 71% | Facebook Reels or Groups 67% | TikTok 59% | Television 34% |
| 🎓 Learning a new skill | YouTube 77% | Facebook Groups 55% | TikTok 43% | Television 26% |
Each was a multiple-choice question, so the rows do not add to 100%. The four shown are the four named most often for each job.
Base: all respondents (n=200). Fieldwork February 2026. Source: Vase.ai.
For news, Facebook at 78% and YouTube at 69% are close enough that we would not call one the leader, with TikTok between them at 55%. All three are named more often than online news sites at 50% and television at 47%, which is worth knowing if you had assumed publishers still own news here.
For entertainment, YouTube Shorts at 71%, Facebook Reels or Groups at 67% and TikTok at 59% are a three-way tie. All three are named clearly more often than television at 34%.
Learning is the exception. YouTube at 77% is clearly ahead of Facebook Groups at 55%, the widest gap on any need we asked about.
Where people say they usually come across a new brand or product for the first time
People could name more than one source, so these do not add to 100%. A further 5% said they do not really look out for new brands.
Base: all respondents (n=200). Fieldwork February 2026. Source: Vase.ai.
Facebook 56%, TikTok 52% and YouTube 51% are a three-way tie for first discovery. All three are named clearly more often than search engines at 26%. If you are choosing one platform to launch something on, this survey does not tell you which.
Why people say they use their main platform
Multiple choice, so this does not add to 100%. People whose main platform is a video or broadcast platform were asked a different version of this question with different answer options, so they are not included here.
Base: the 140 people whose main platform is a social platform (TikTok, Facebook, Zalo, X or LinkedIn) (n=140). Fieldwork February 2026. Source: Vase.ai.
The top three reasons sit close together: entertainment 69%, keeping up with news 66% and staying in touch 58%. All three are named clearly more often than learning tips 40%, discovering products 39% and following creators 36%. People are not on these platforms for one reason, which is part of why no platform specialises.
Stop running the platform-selection argument and start running the format and offer argument. On this evidence a brief that says "TikTok for discovery, YouTube for consideration" is asserting something the data does not show. Two choices it does support: put the budget weight where the time is, which is Facebook, and put anything that teaches or explains on YouTube.
Feeds already sell, and they sell everyday things
Short answer: 71% said they have bought something after seeing it on their main platform. Fashion is clearly the most common category, and most of the money sits under 1.5 million VND.
Have you bought anything after seeing it on your main platform? (N=200)
Single choice. Each figure is rounded once from the raw data, which makes the column read as 102%.
Base: all respondents (n=200). Fieldwork February 2026. Source: Vase.ai.
"Once or twice" and "several times" are close enough to read as one group: 71% in total said they have bought at least once. 12% said never. The 14% who considered it and did not are the interesting middle, because they got close enough to weigh it up.
What buyers say they bought
People could name more than one category, so these do not add to 100%. A further 1% were not sure and 1% named something else.
Base: the 141 people who said they have bought after seeing something on their main platform (n=141). Fieldwork February 2026. Source: Vase.ai.
Fashion at 79% is clearly ahead of everything else. Groceries and food and drink 55%, beauty 53% and electronics 41% sit close together in a second group. Home 25% and travel 23% are clearly behind.
The largest single purchase of this kind
Single choice. Each figure is rounded once from the raw data, which makes the column read as 101%.
Base: the 140 buyers who stated their largest purchase of this kind (n=140). Fieldwork February 2026. Source: Vase.ai.
Was that purchase in line with what they normally spend?
Single choice.
Base: the 139 buyers who compared that purchase with their usual spending (n=139). Fieldwork February 2026. Source: Vase.ai.
The 500,000 to 1,499,999 VND band at 44% is clearly the most common answer, and adding the two lowest bands before rounding, 63% named a figure under 1,500,000 VND.
How people say they feel about ads on their main platform
Single choice. A small number of other answers are not shown, so this does not add to 100%. These are attitudes people report about advertising, not a measure of how many sales advertising causes.
Base: the 193 people who named a main platform and said how they feel about ads on it (n=193). Fieldwork February 2026. Source: Vase.ai.
Read this next to the purchase chart, not on its own. 35% said they sometimes pay attention if the ad is relevant and 23% said they usually skip or ignore ads, which are close. Only 18% described themselves as regularly discovering things they end up buying. Yet 71% said they have bought after seeing something on that platform. People do not credit the ad slot for the purchase, and they buy anyway.
What people say they engage with most on their main platform
People could name more than one, so these do not add to 100%.
Base: the 180 people who named a main platform and said which content they engage with most (n=180). Fieldwork February 2026. Source: Vase.ai.
The longest video people say they will watch all the way through on their main platform
Single choice.
Base: the 180 people who named a main platform and gave a video-length ceiling (n=180). Fieldwork February 2026. Source: Vase.ai.
Neither of those has a winner. The top five content types are all within range of each other, and the length ceiling splits roughly into thirds: 32% said more than three minutes, 32% one to three minutes, and 36% sixty seconds or less, adding the three shortest bands before rounding. A campaign that makes one length in one format will miss most of this audience.
We asked the 141 people who had bought to describe, in their own words, how the platform influenced the decision, then grouped the answers.
| How they described it | % of the 141 buyers who answered |
|---|---|
| The platform had a large influence | 17% |
| They named a specific platform | 14% |
| The content itself was engaging | 13% |
| Reviews and ratings | 9% |
| Advertising | 9% |
| Convenience and trust | 7% |
| Discovering new products | 6% |
| Promotions | 5% |
| Product variety | 4% |
| No clear reason given | 18% |
Open-text answers, grouped afterwards. One answer could fall into more than one group and 12% could not be grouped, so these do not add to 100%.
Base: the 141 buyers who described the influence in their own words (n=141). Fieldwork February 2026. Source: Vase.ai.
Open-text answers were in Vietnamese. Three, quoted as written, with a translation: "khi tôi thấy 1 video về 1 người sử dụng sản phẩm đó, tôi ấn tượng tôi sẽ mua" (when I see a video of someone using that product, it makes an impression and I will buy). "nó giới thiệu cho tôi nhiều sản phẩm tôi quan tâm" (it introduces me to a lot of products I care about). "Nó quảng cáo quá rẻ nên tôi mua hoặc tôi đang muốn mua mà nó hiện" (the ad was so cheap that I bought, or it showed up just when I was wanting to buy).
How people say they react to festive ads around Tet, Mid-Autumn Festival and National Day (N=200)
Single choice. Each figure is rounded once from the raw data, which makes the column read as 102%.
Base: all respondents (n=200). Fieldwork February 2026. Source: Vase.ai.
37% said they actively engage with festive ads, meaning a like, share, comment or click. That is clearly more than the 22% who pay attention without interacting, and far more than the 5% who said they usually skip them.
Build the offer for a 500,000 to 1,500,000 VND basket, because that is where the largest purchase sat for 44% of buyers and only 8% called it a splurge. Volume will move before order value does. Make more than one length and more than one format, because the audience does not agree on either. And treat festive as a window where people will act, not only look.
What people say has changed since a year earlier
Short answer: We did not measure the same people twice, so this is what they recall. Most say they are spending more time or about the same, and the group who say they are spending more also report buying repeatedly more often.
Compared with what they recall of a year earlier, time spent with media (N=200)
Single choice.
Base: all respondents (n=200). Fieldwork February 2026. Source: Vase.ai.
Compared with what they recall of a year earlier, platforms used (N=200)
Single choice.
Base: all respondents (n=200). Fieldwork February 2026. Source: Vase.ai.
On time, 49% said more and 39% said about the same, close enough to read together: most said they are spending at least as much time with media as they recall spending a year earlier. 7% said less. On platforms, 43% said the same ones and 42% said they have picked up a new online platform, also close. These are comparisons with what people remember, not measurements taken a year apart.
Say they have bought several times, by what they recall about their media time
Both groups are small, between 50 and 99 people, so read them as directional rather than exact. The group who said they spend less time is too small to report at all and is not shown.
Base: respondents in each recalled-change group (n=175). Fieldwork February 2026. Source: Vase.ai.
42% of the group who said they now spend more time with media also said they have bought several times after seeing something on their main platform, against 22% of the group who said their time is about the same. That is a wide enough gap to report, with the caution that both groups are small. It says the two things go together. It does not say one causes the other.
If you can identify people whose media use is expanding, they are a group worth weighting towards, because they report repeat buying more often. Treat it as a tilt in how you weight spend, not as a new target audience: both groups here are small, and a single survey cannot tell you which way the arrow points.
🎯 Section 3
Recommendations
Findings are the payload; these are the principles they support, each with what to measure.
📐 For marketers and media planners
Facebook 81%, YouTube 77% and Zalo 74% weekly are too close to separate at this sample size, so a reach-led argument for one over another is not supported here. Time is different: 39% name Facebook as the platform they spend the most time on against 20% for YouTube. Measure: share of budget by platform against share of main-platform mentions, not against weekly reach alone.
YouTube at 77% is clearly ahead of Facebook Groups at 55% for learning a skill. It is the only clear specialism in the whole study. Measure: completion and save rates on explainer content by platform.
Facebook 78% and YouTube 69% are named more often for news than online news sites 50% or television 47%. Publishers are still named by half the people surveyed, so they are a real audience, just not the main one. Measure: share of news-adjacent budget against where people say they go for news.
✍️ For creative and content teams
32% said they will watch more than three minutes, 32% one to three minutes, and 36% stop at sixty seconds or less. No single length reaches the whole audience. Measure: completion rate by length, reported separately rather than blended.
Short video 53%, photos 49%, long video 48%, Stories or Reels 46% and text posts 43% are all named at similar rates as what people engage with most. Measure: engagement by format on your own channels, against this spread.
When buyers described the influence in their own words, the content being engaging (13%), reviews and ratings (9%) and advertising (9%) were the themes named after simply saying the platform had a large influence (17%). Measure: conversion on creative that demonstrates the product against creative that only claims.
🛍️ For e-commerce and performance teams
44% of buyers put their largest purchase of this kind in that band, 62% said it was within their usual spending range and only 8% called it a splurge. Fashion leads the categories at 79%. Measure: order volume separately from average order value.
14% said they considered a purchase after seeing something on their main platform and did not make it. They are already interested. Measure: how many of the people who consider go on to buy, tracked separately from overall conversion.
37% said they actively engage with festive ads, clearly more than the 22% who pay attention without interacting, and only 5% said they usually skip them. Measure: interaction rate on festive creative, not reach alone.
Filter all 200 responses by platform, where people say they first meet a brand, and what they say they spent. See the numbers behind every finding in this report.
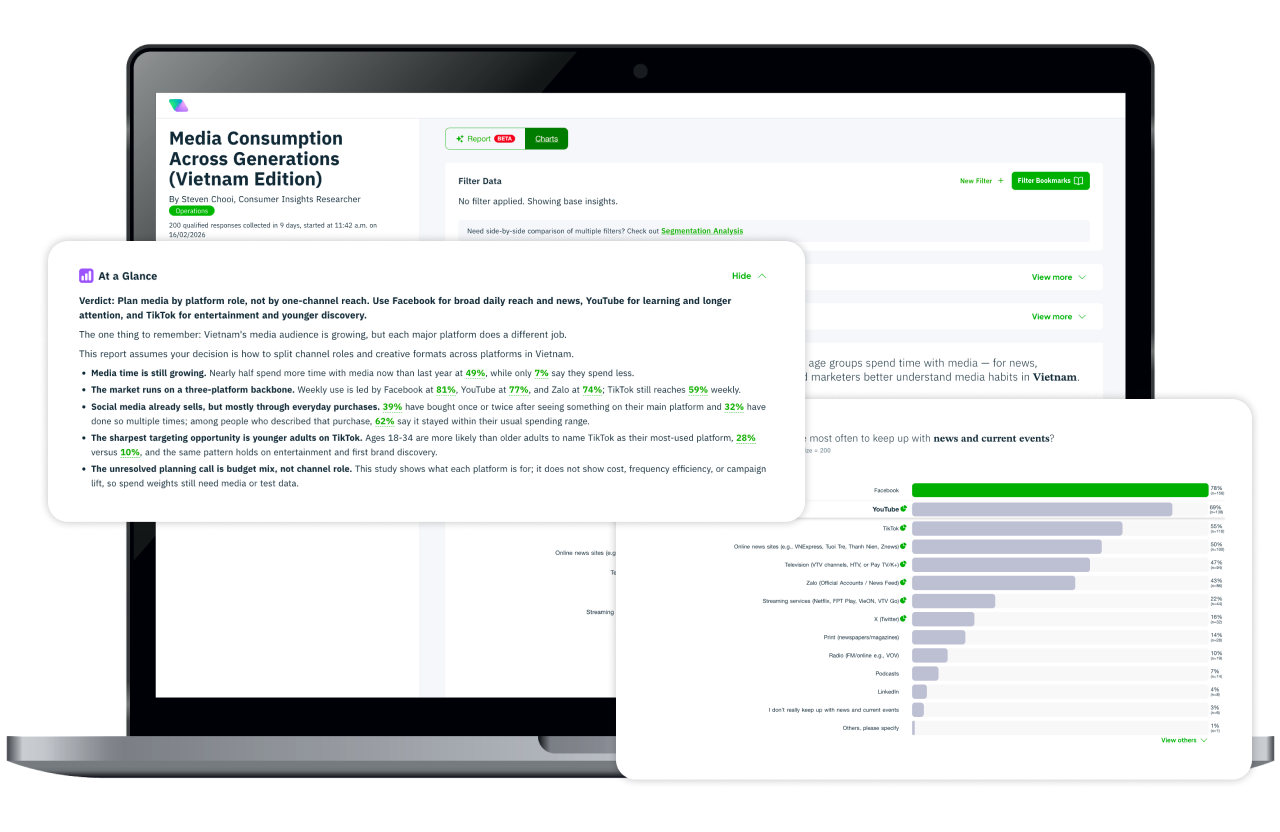
Note: The dashboard is best viewed on laptop or desktop.
Frequently asked questions