
Vase.ai Consumer Insights | Malaysian Mall-Goers | N=500 | Fieldwork 2026
Nine in ten Malaysians visited a mall in the past month. Only one in five still thinks of it as a place to shop. Here is what the mall has quietly become, and what actually turns a visit into spend.
Malaysians have not stopped going to the mall. 91% visited in the past month, yet only one in five still calls the mall a place to buy things. This study asks the question footfall counters and sales feeds cannot answer: what is the mall actually for now, and what flips a casual visit into spend? We surveyed 500 Malaysians on their real, most-recent trips, and the answer reshapes where retail, F&B, and mall operators should be putting their attention over the next year.
Here's What We'll Cover:
- 📋 About This Study
- 1. 🛍️ Know the Mall-Goer
- 2. 📊 The Bottom Line: Five Findings
- 3. 🏛️ Chapter 1: The Mall Stopped Being a Shop a Long Time Ago
- 4. 💳 Chapter 2: Two Levers Move the Basket
- 5. 👕 Chapter 3: Physical Retail Wins on Touch, Not Service
- 6. 🍜 Chapter 4: The Dining Decision Is Made at the Door
- 7. 🎯 Recommendations
- 🔒 Go Deeper: Filter the Full Dataset by Demo, Frequency and Spend
📋 About this study Show more ▾
This report is based on a survey of 500 Malaysian adults (general population) conducted in 2026 on Vase.ai's consumer panel of 450,000+ verified Malaysian respondents. It was not commissioned by any brand, retailer, or mall operator. The analysis is independent.
It measures stated and recalled behaviour and attitudes: what people did on their most recent trip, what draws them in, what they think a mall is for, and what decides their spend. It does not replace footfall counters, tenant sales feeds, or receipt-scan panels. It is the layer those tools cannot see, the intent and the trigger behind the traffic.
🛍️ Section 1
Know the mall-goer
Short answer: Malaysians visit malls often, 91% in the past month, stacking four to five purposes per trip and spending a mean of about RM260, but most no longer think of the mall mainly as a place to shop.
|
91%
🛍️ visited a mall in the past month
|
32%
🔁 went five or more times
|
76%
💰 spent RM100+ on their last trip
|
4.5
🧺 average purposes stacked per trip
|
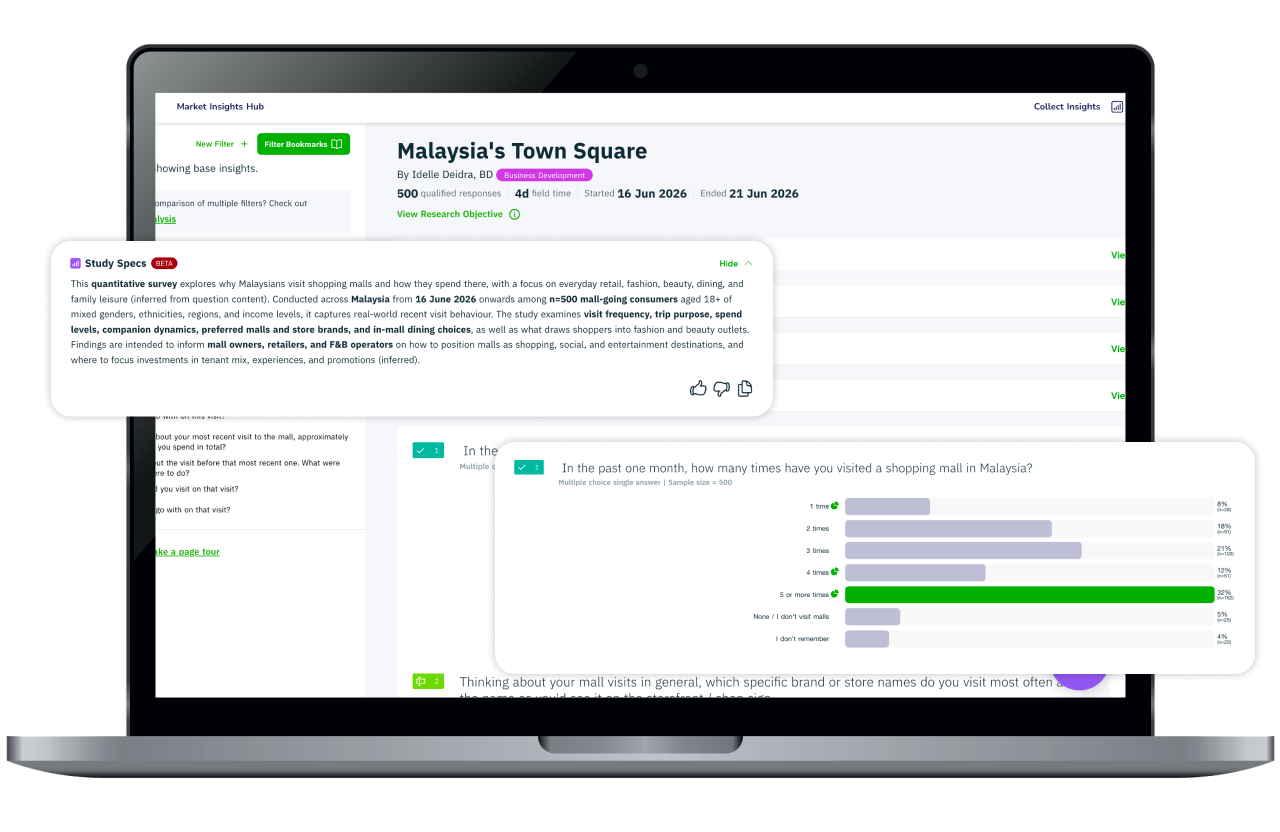
Do Malaysians still go to shopping malls? Yes, and routinely. 91% visited a mall at least once in the past month, and 32% went five or more times. Only 5% say they do not visit malls at all. For most Malaysians the mall is a recurring destination, which means every visit is a repeat at-bat for the brands inside it.
They do not go for one thing. The average visiting trip stacks about four to five distinct purposes (4.5 on average): groceries, a meal, a specific buy, a wander, all in one visit. Only 13% of trips are single-purpose.
They are not light spenders. Among visitors who recalled their last trip (n=451), 76% spent RM100 or more, 28% spent RM300 or more, and 99% spent something, with a mean recalled spend of about RM260. The mall trip is a meaningful wallet event.
The store Malaysians name first is AEON. Asked which store they visit most often at the mall, AEON leads the named brands at 16% (about one in six), ahead of Watsons (13%) and Uniqlo (13%), with Padini (9%) and Mr DIY (8%) close behind. The anchor tenant is still the gravity well; the specialty stores orbit it.
Most-visited store at the mall (% naming it first):
📊 Section 2
The Bottom Line
- Food, not fashion, is the anchor. 71% say food and dining variety is what would make them spend a free day at a mall, the single most-cited draw, ahead of cafes to socialise (59%) and cinema or arcade (51%). Only 8% say a free day at the mall is just for shopping.
- The mall has been re-zoned as social space, and the young rezoned it hardest. Asked what a mall means to them, 31% say "a social space to hang out, eat, and spend time" and only 20% say "primarily a place to shop." Among under-30s that gap is a chasm: 44% call it a social space and just 15% call it a shop.
- Two things move the basket, and they are not the ones marketers guess: income and how often you visit. The M40 mid-tier already spends like the T20, and frequent visitors out-spend occasional ones on every trip, independently of income. Age is a real but secondary signal (under-30s spend about a quarter less), and guessed trip intent does not predict spend at all.
- Physical retail wins on touch, immediacy, and price, not service. Among fashion and beauty shoppers, the reasons to buy in-store rather than online are being able to try or feel the product (71%), getting it immediately (57%), and an in-store-only discount (56%).
- The dining decision happens inside the mall. 70% of diners had not locked in where to eat before arriving. The menu on display, a set deal, and a short queue decide it on the spot.
The mall stopped being a shop a long time ago
Short answer: Not mainly for shopping. Only 20% call the mall primarily a place to shop, while 31% call it a social space and 71% are drawn in by food and dining.
What do Malaysians actually use shopping malls for? Not mainly shopping. Asked what a mall means to them, 31% chose "a social space where I hang out, eat, and spend time" and another 14% chose "a leisure destination for the family." Only 20% picked "primarily a place to shop." A further 22% treat it as a practical errands and necessities hub, so the mall is not purely a social space either, but the shop-first view is now a clear minority. The mall has been re-zoned in people's heads from shop to a place you go to be, not just to buy.
What a mall means to Malaysians:
And the rezoning is generational. Split that same question by age and the shift is dramatic: 44% of under-30s call the mall a social space against only 22% of those aged 45 and over, while just 15% of under-30s still call it a place to shop versus 23% of the older group. The mall did not change first. The young did, and they are dragging the definition with them.
That shows up in what would pull people in for a free day. Food and dining variety leads at 71%, well ahead of any retail driver, with cafes and places to socialise at 59% and cinema, arcade, and games at 51%. The "I only go to shop" hardliner is a rounding error at 8%.
What would make you spend a free day at the mall:
And it shows up in behaviour. The average trip stacks around four to five purposes, and 64% of people whose main mission was groceries or a specific purchase also ate out on the same trip. Retail is rarely the reason people come. It is what they do while they are there for something else.
Retail and F&B brands are an interception play, not the destination. The destination is food, family, and time to spend. Position to catch a shopper already in motion, sited near the anchors that pull the footfall. For mall operators, the leasing pitch is experience first, retail as the adjacency, and the experience case only strengthens as the younger, social-first cohort ages into higher spend.
Two levers move the basket: how much you earn and how often you come
Short answer: Income tier and visit frequency, working independently. The M40 (RM334) spends like the T20 (RM342), and five-times-a-month visitors spend RM327 a trip versus RM195 for occasional ones. Guessed trip intent predicts nothing.
Who spends the most at Malaysian malls? Two things predict trip spend, and they work independently of each other: household income and how often someone visits. Age matters too, but less, and not in the straight line a marketer expects. The one variable that does not predict spend is the one brands lean on most heavily: guessed trip intent.
Income. Mean recalled spend climbs from RM205 for the B40 (under RM5k household income) to RM334 for the M40 (RM5k to RM10k), a jump that is large and statistically robust. It then flattens: the T20 averages RM342, which is statistically level with the M40. The mid-tier already spends like the top tier. (The T20 base is the smallest at n=63, so read the top-tier figure as indicative rather than precise.)
Mean recalled spend by income tier (RM, shared axis):
Frequency. Visit frequency is a second, separate lever. Per-trip spend rises from RM195 for people who came once or twice in the month to RM327 for those who came five or more times. This is not income in disguise: frequency and income barely move together, and when both are tested at once each stays significant. A frequent visitor spends more on each trip and takes more trips, so their value compounds. The frequency gap is steepest among the M40 and T20.
Mean recalled spend by visit frequency (RM, shared axis):
Age. Age is the weaker lever, but it is not nothing. A simple linear correlation between age and spend is near zero, which is why it is tempting to write age off. That correlation hides the real pattern, because the relationship is not a straight line. Cut spend by age band and a clear gap appears: under-30s spend RM210 on average, against RM297 for 30-to-44s and RM271 for the over-45s. Under-30s spend about a quarter less, and that gap is statistically significant. It is not just an income effect either: even after accounting for income tier, being under 30 is independently associated with roughly RM66 less per trip. So age is a real, secondary axis.
Mean recalled spend by age band (RM, shared axis):
Intent. We also tested the popular idea that "just browsing" shoppers spend differently from mission shoppers. They do not: the difference is not statistically significant. Guessed trip intent is not the lever. Income and frequency are, with age a step behind.
The M40 mid-tier is the underserved high-value audience, premium offers reserved for "the top bracket" miss the shoppers who already spend at top-bracket levels. But income is only half the story. Frequency is an independent, compounding lever, so the single highest-value shopper is the mid-income regular, not just the high earner. Build for repeat visits (loyalty, reasons to return), not only for the big-basket one-off. Layer age on top as a secondary cut: the under-30 basket is a build-the-habit play (lower spend today, the social-first cohort that will define the mall tomorrow), not a premium-spend target yet. The variable that genuinely does not predict spend is guessed trip intent.
Physical retail wins on touch, not service
Short answer: Touch, immediacy, and price. 71% want to try or feel the product, 57% want it immediately, and 56% are pulled in by an in-store-only discount.
Why do Malaysians still buy fashion and beauty in-store instead of online? Among the 296 fashion and beauty shoppers in the sample, the reasons are tactile and immediate:
What makes you buy in-store rather than online (% of fashion/beauty shoppers):
The top three are touch, immediacy, and price. Read this as differentiation, not importance. The question asks what physical retail has that e-commerce lacks. Staff and ambience score lower here because they are not what online is missing, not because they do not matter in-store. The honest takeaway is that physical retail's edge over e-commerce is sensory, immediate, and price-led. Do not read it as a licence to cut staff or fit-out.
Getting a shopper into an unfamiliar store runs on different fuel. A visible sale or promotion (71%) is the dominant pull, but the next two are telling: a product already seen on social media beforehand (38%) and free samples or testers (36%) beat an eye-catching window (34%) and a brand-new store (30%).
What pulls a shopper into an unfamiliar store:
The storefront's first job is to broadcast the promotion legibly. And social is doing in-mall work: more than a third of entries to an unfamiliar store were pre-seeded online. Brief your social team and your visual-merchandising team as one funnel, not two.
The dining decision is made at the door
Short answer: At the door. 70% of diners had not chosen a place before arriving; the menu on display, a set deal, and a short queue decide it on the spot.
How do Malaysians decide where to eat at a mall? Mostly after they arrive. 80% dined at a mall in the past month. Among them (n=401), 70% had not committed to a place before arriving: 36% had a few options in mind and 33% decided only once inside. Just 26% walked in with one specific place locked.
That means the choice is won in the mall, in the moment:
What decides where to eat (% of diners):
Trust and familiarity lead, which favours established chains, but the next tier is fully controllable at the storefront: visible food, a deal, and a manageable queue. Social media (15%) and ads (6%) barely register at the point of decision, even though social clearly drives discovery earlier in the journey. The dining funnel is "seen online, decided at the door."
For F&B brands, the highest-leverage asset is the shopfront in the 30 seconds a hungry, undecided group walks past: appetising visible food, a clear set-deal, and a queue that does not scare people off. For challengers without trust equity, the "something new" opening (25%) is real, but it has to be earned at the threshold, not in a feed.
🎯 Section 4
Recommendations
Findings are the payload; these are the principles they support, split into quick wins and strategic moves, each with what to measure.
🛍️ For retail and fashion-beauty brands
Make the promotion the most legible thing about the storefront. 71% of unplanned entries are pulled in by a visible sale. Measure: walk-in rate when promo signage is readable from the walkway versus not.
Build the in-store experience around touch and immediacy: try-ons, testers, take-it-home-today. Measure: conversion on sampled versus non-sampled SKUs.
Run social and visual merchandising as one funnel; 38% of unfamiliar-store entries were pre-seeded online. Measure: in-store lift on the products you pushed online that week.
🍜 For F&B brands and operators
Treat the shopfront as the conversion engine. With 70% undecided at arrival, visible food, a clear set-deal, and an honest queue signal will outperform any pre-visit campaign at the point of choice. Measure: walk-in rate versus menu-board visibility.
Challengers: win the threshold, not the feed. A quarter of diners are open to something new, but only if it is legible at the door.
🏬 For mall operators and landlords
Lead with food and experience; merchandise retail as the adjacency. Food is the 71% draw and the anchor of most trips. Programme events and family activities to extend dwell, because longer visits stack more of the roughly four-to-five purposes per trip, which lifts every tenant.
Build for frequency, not just footfall. Frequent visitors spend more per trip and visit more often, so the compounding value is in the regular, not the one-off. Measure: share of monthly visits from 5+-times visitors, and their per-trip basket.
Build for the social-first cohort. Under-30s already see the mall as a social space (44%) far more than older shoppers do; design and tenant mix should follow the cohort that will define the next decade of footfall.
💳 For all brands inside the mall
Lead spend strategy with two levers, income tier and visit frequency, then layer age. The M40 mid-tier (RM334 mean spend) already spends level with the T20 (RM342) and well above the B40 (RM205), so do not reserve premium offers for the top bracket. Frequency is the second, independent lever: a 5+-times visitor spends RM327 per trip versus RM195 for an occasional one, on top of visiting more often, so the mid-income regular is the highest-value shopper. Give them reasons to return, not just reasons to spend big once. Age is the secondary cut: under-30s spend about a quarter less (RM210 versus RM297 for 30-to-44s), so treat them as a habit-building audience, not a premium-spend one. Measure: basket value by income tier and visit frequency first, age band second.
Filter all 500 responses by demographic, visit frequency, and spend tier. See the numbers behind every finding in this report.
Note: The dashboard is best viewed on laptop or desktop.
Frequently asked questions