
Vase.ai Consumer Insights | Malaysian Grocery Shoppers | N=486 | Fieldwork 2026
Malaysian grocery shoppers are rearranging their baskets at a pace not seen in recent memory. Between a rising cost of living, geopolitical tension that has bled into consumer brand choice, and the everyday pull of promotions and social media, the question for any FMCG brand operating in this market is no longer whether shoppers are switching. They are. The question is which categories, which segments, which brands, and how durable the switch will be.
This report answers those questions using a survey of 486 Malaysian grocery decision-makers conducted in 2026. It is written for FMCG brand managers (both international and local), retailer category managers, and media planners who need to make brand, channel, and pricing decisions in the next 12 months.
The report has three goals:
- Quantify the scale and shape of the brand switching happening right now.
- Identify the categories where the switch is most visible and most likely to stick.
- Translate the data into specific actions that brands can take in the near term and over the next 12 months.
The data comes from Vase.ai's proprietary Malaysian consumer panel. This study was not commissioned on behalf of any brand or category. The analysis is independent.
Here's What We'll Cover:
- 📋 About This Study
- 1. 🛒 Know the Shopper
- 2. 📊 Key Findings
- 3. 💸 Chapter 1: Shoppers Are Paying More and Feeling It
- 4. 🇲🇾 Chapter 2: The Local Shift Is Real
- 5. 📉 Chapter 3: Which Categories Have Lost Loyalty, and Which Have Not
- 6. 📱 Chapter 4: How Shoppers Discover and Try New Brands
- 7. 🎯 Recommendations
- 🔒 Go Deeper: Filter the Full Dataset by Brand, Category and Demo
📋 About this study Show more ▾
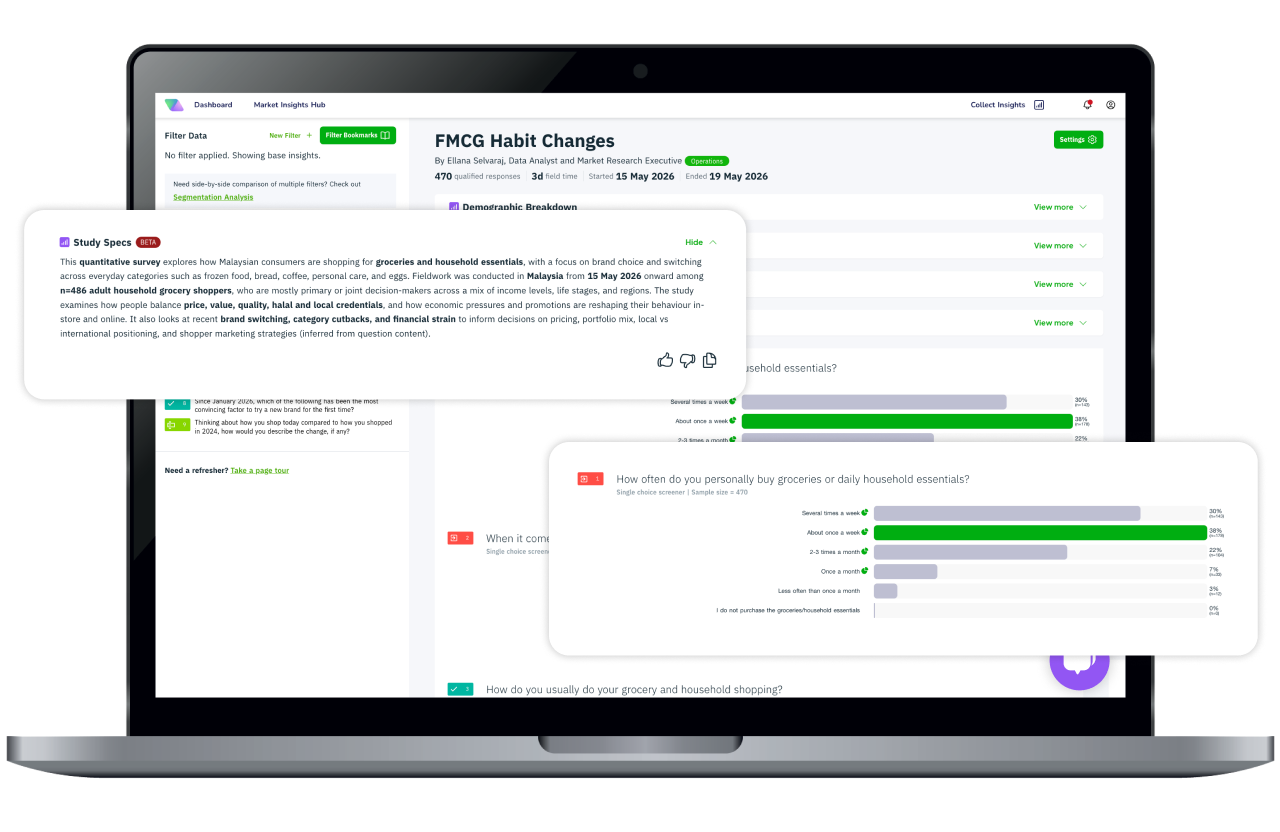
Fieldwork: Conducted by Vase.ai in 2026 via a mobile-first online survey platform, with completions verified through the platform's standard quality checks.
Base: N=486 qualified Malaysian grocery and household decision-makers. Respondents were qualified on the basis of being involved in grocery and household purchasing decisions for their household.
Sample composition: The sample reflects the major demographic dimensions of the Malaysian shopper population: a balanced gender split, an age range from 18 to 70+ years old spread across five age bands, all major ethnic groups (Malay, Chinese, Indian, Non-Malay Bumiputera, and Indian/Others), and all five regions of Malaysia (Central, Northern, Southern, East Coast, and East Malaysia).
What was measured: The survey covered brand switching across 20 grocery and household categories, the reasons behind those switches, the triggers that drove trial of new brands, brand-level mentions in five deep-dive categories (frozen food, bread, coffee, personal care, eggs), and the macro context shoppers are operating in.
Time frame anchor: All behavioural questions in this report use "since January 2026" as the anchor. We are reporting on what shoppers are doing right now, not on retrospective comparisons to earlier years.
Deep-dive categories: Frozen food, bread, coffee, personal care, and eggs were selected for brand-level follow-up. Brand-level data is limited to these five categories. Switching rates for the other 15 categories are reported at the category level only.
Independence: This study was not commissioned on behalf of any brand or category. The analysis is independent.
🛒 Section 1
Know the Shopper
🧺 The weekly basket owner
67.7% shop for groceries at least once a week (30% several times a week, 37.7% about once a week). This is not a market of occasional buyers. These are habitual, high-frequency shoppers for whom every price signal and brand change compounds quickly.
Physical retail is still the backbone of Malaysian grocery. 98.6% shop in physical stores. Only 48.3% shop online at all. Among those who do both, 65.8% still lean toward physical stores more often. The online grocery wave is real, but it has not displaced the hypermarket trip.
|
67.7%
🗓️ shop for groceries at least once a week
|
98.6%
🏪 shop in physical stores
|
48.3%
📦 shop online at all
|
46.1%
👤 are the sole household purchase decision maker
|
🧑🤝🧑 Who decides and who pays attention
46.1% are the sole purchase decision maker in their household. Another 46.1% co-decide. This means marketing messages that reach the shopper are reaching the decision maker. There is very little filtering between exposure and the basket.
📊 Section 2
Key Findings
- 83.3% switched brands in at least one FMCG category since January 2026. Only 16.7% made zero brand changes.
- 71.6% are spending more on weekly groceries. Only 14.0% are spending less.
- 71.4% have increased what they spend on promotions and discounts. This is the single largest behavioural shift in the data.
- Personal care has the highest brand switching rate at 53.1%, well ahead of snacks (35.8%), rice and grains (33.5%), and coffee (33.3%).
- Among switchers, the most common action across all categories was switching to a Malaysian or local brand, followed by switching to a cheaper brand.
- Despite switching, the majority return to their original brand occasionally or fully. Coffee and personal care show the highest rates of permanent defection (20%+ have not gone back and are unsure they will).
- 34.2% of households report job stability anxiety. 41.6% are saving less than before. These are not outlier stresses, they are majority experiences.
Halal certification ranked #1 at 34.5%, followed by price (23.8%) and product quality (13.8%).
Shoppers Are Paying More and Feeling It
71.6% of Malaysian shoppers are spending more on weekly groceries, but this is not confident spending. It is inflationary pressure being absorbed reluctantly.
Only 14.0% are spending less. The rest are absorbing higher prices on familiar baskets rather than trading up.
34.2% say their household has experienced job stability anxiety since January 2026. Another 23.5% are concerned about political impact on their job. 12.6% report outright job loss. In practical terms, more than one in three shoppers is making purchase decisions under a cloud of income uncertainty.
|
34.2%
😰 report job stability anxiety since January 2026
|
12.6%
📉 report outright job loss
|
Against that backdrop, 41.6% are saving less than before but managing, and 33.7% are struggling to manage monthly expenses (26.1% somewhat struggling, 7.6% badly). The shopper walking the aisle is not flush. They are optimising.
This explains the most dramatic behavioural shift in the data: promo chasing. 71.4% have increased their spend on promotions and discounts, with 22.4% doing so significantly. Promotions have shifted from a nice-to-have mechanic to a primary purchase trigger.
Shoppers' own words back this up. Unprompted responses about what has driven change and what causes the most anxiety are dominated by price and cost-of-living:
"harga naik," "kenaikan harga mendadak," "rising costs and inflation have been the biggest drivers," "kenaikan harga bahan api petrol dan menyebabkan kenaikan harga barang."
Job loss and income uncertainty follow. Boycott or country-specific language appeared in fewer than 2 responses across all 486 open-ended answers. The dominant anxiety is economic, not geopolitical.
Your shoppers' baskets are getting more expensive, but your shoppers are not loyal out of habit. They are loyal to the best price they can find that week. Brands not in the promotional ecosystem are not in the consideration set.
The Local Shift Is Real
Among shoppers who switched brands, switching to a Malaysian or local brand was the top or second-most cited action in every category tested. It outranks even trading down to a cheaper brand in coffee and personal care.
Stated brand switching actions, among those who changed brand in each category:
| Category | 🇲🇾 Switched to local / Malaysian | 💲 Switched to cheaper | 🏬 Switched to store brand |
|---|---|---|---|
| 🧊 Frozen food (n=134) | 59.7% | 56.0% | 44.0% |
| ☕ Coffee (n=162) | 46.9% | 37.0% | 18.5% |
| 🧴 Personal care (n=258) | 41.9% | 33.7% | 17.8% |
| 🍞 Bread (n=112) | 42.0% | 26.8% | 21.4% |
| 🥚 Eggs (n=127) | 36.2% | 25.2% | 19.7% |
The reasons are layered. When asked why they switched brands overall, 51.6% cited better value for money, 44.7% cited better quality, 31.1% said they needed to spend less, and 24.7% specifically said they wanted to support a local brand. This is not purely economic. There is a values dimension.
The values angle is strongest among Malay and Indian shoppers. Malay respondents (31.0%) and Indian/Others (35.5%) are the most likely to cite local brand support as a switching reason. Chinese respondents (9.4%) are the least likely. Chinese shoppers' switching is primarily quality and value driven.
The country-of-origin avoidance signal is a secondary thread, not the lead story. Only 10.3% cited avoiding a brand from a particular country as a switching reason. Boycott or country-avoidance language appeared in barely 2 open-ended responses about anxiety. This is a values-driven local shift, not primarily a political boycott shift.
If you are an international brand, your defensible position is quality and value, not heritage. If you are a local brand, this is the strongest window in years to convert trial into preference. But it is a window, not a permanent state. The majority of switchers are still buying their old brand occasionally.
Which Categories Have Lost Loyalty, and Which Have Not
Personal care is the highest-disruption category in Malaysian FMCG right now. 53.1% of respondents switched brands since January 2026, the highest of any category tested. Among those switchers, 41.9% moved toward local or Malaysian brands, and 33.7% traded down in price.
Most worryingly for international brands in personal care: 23.9% of personal care switchers have either not gone back and are unsure they will, or do not intend to return. This is the highest at-risk rate of any category studied.
Coffee is the second-highest risk category for brand retention. 33.3% switched brands, 46.9% of switchers moved toward a local brand, and 20.3% have not returned to their original brand and are unsure or unwilling to. The brand-name data tells the same story: Nescafé dominated mentions of what people were buying in January 2026, but in current responses Nescafé mentions drop noticeably while Aik Cheong, Wonda, and ZUS gain ground.
Bread and eggs show the highest return-to-original rates. In bread, 94.3% of switchers have either returned fully or buy both occasionally. In eggs, 91.9% have done the same. These categories have low emotional investment, high price sensitivity, and physical availability driving decisions. Switching happens, but so does reverting. Bread and eggs brands should care more about distribution and on-shelf pricing than permanent loyalty erosion.
Brand switching by category, full picture:
| Category | 🔄 % who changed brand | ⚠️ % unsure or won't return |
|---|---|---|
| 🧴 Personal care | 53.1% | 23.9% |
| 🍫 Snacks, biscuits, chocolate | 35.8% | not deep-dived |
| 🌾 Rice and grains | 33.5% | not deep-dived |
| 🫙 Sauces and condiments | 33.5% | not deep-dived |
| ☕ Coffee | 33.3% | 20.3% |
| 🧹 Household cleaning | 32.3% | not deep-dived |
| 🥤 Beverages | 30.2% | not deep-dived |
| 🍜 Instant noodles | 29.0% | not deep-dived |
| 🧊 Frozen food | 27.6% | 14.2% |
| 🫙 Cooking oil | 26.7% | not deep-dived |
| 🥩 Eggs, meat, poultry | 26.1% | 14.3% |
| 🍞 Bread and bakery | 23.0% | 5.7% |
Only 16.7% of shoppers made no brand change at all.
If you are in personal care or coffee, your most urgent problem is not acquisition. It is preventing permanent defection. With 20-24% of switchers showing low intent to return, you are losing buyers not just to trial but potentially for good. Win-back programs need to activate now.
How Shoppers Discover and Try New Brands
The trial funnel is now promotion-led and platform-influenced. The classic recommendation-and-word-of-mouth path has been overtaken by deal-driven and feed-driven discovery.
Top triggers to try a new brand since January 2026:
| Trigger | % cited it | Most convincing single reason |
|---|---|---|
| 🏷️ Promotion or discount | 49.6% | 37.6% |
| 🤔 Curiosity, wanted to try something new | 37.0% | 19.6% |
| 📱 Saw it on social media | 34.6% | 15.4% |
| 🗣️ Recommended by someone I trust | 27.4% | 7.6% |
| 🇲🇾 Wanted to support a Malaysian brand | 21.0% | 9.9% |
| 💸 Usual brand too expensive | 11.9% | 4.2% |
| 🚫 Avoid brand from certain country | 7.0% | 2.1% |
11.5% have not tried any new brands since January 2026. A stable loyalist minority. The remaining 88.5% are, in principle, reachable.
Social media discovery is sharply age-skewed. 48.5% of 18-24 year-olds said social media influenced them to try a new brand, dropping progressively to 27.6% among 45-54 year-olds. This is a meaningful enough gap to justify age-segmented activation strategies.
The "wanted to support a Malaysian brand" motivation sits at 21.0% as a trial trigger and 9.9% as the single most convincing factor. It is real, but it is a supporting layer, not the primary acquisition driver. Brands leaning on local patriotism alone without a compelling price-to-quality story will not close the deal.
The "wanted to support a Malaysian brand" motivation sits at 9.9% as the single most convincing factor. It is a supporting layer, not the primary acquisition driver. Brands leaning on local patriotism alone without a compelling price-to-quality story will not close the deal.
Promotional investment is no longer optional for new product launches. It is the main discovery channel. If your brand has pulled back from promotions to protect margin, you have effectively opted out of trial. Social media activation, particularly for under-35 audiences, is the second lever.
🎯 Section 4
Recommendations
🧴☕ For brand managers in high-churn categories (personal care, coffee)
Your most urgent problem is preventing permanent defection, not acquisition. With 20-24% of switchers in personal care and coffee showing low intent to return, you are losing buyers not just to a trial but potentially for good. Win-back programs need to activate now: targeted promotions toward lapsed buyers, reminders of the reasons they originally chose your brand. Loyalty mechanics that reward returning buyers are underused in Malaysian FMCG.
Switching is driven almost equally by "better value for money" (51.6%) and "better quality" (44.7%), not just "cheaper" (31.1%). Price-matching without a quality narrative is incomplete. If you are an international brand, competing on quality differentiation is still viable. Shoppers have not abandoned quality as a criterion. They are looking for it at the right price.
Premium loyalty is not protecting you at higher income tiers. Switching rates are 90%+ among RM8,001+ households, slightly higher than lower-income brackets. The M40 and upper-M40 are not insulated from the basket rethink. Treat them as a defection risk, not a stability anchor.
🇲🇾 For local and Malaysian brands
This is the best window you will have in years. 24.7% of brand switchers explicitly cited "wanting to support a local brand" as a reason. The local-brand tailwind is strongest in personal care and coffee. But it is a window, not a permanent state. 56-62% of switchers across categories are still buying their old brand occasionally. If you do not convert this trial into preference, they will drift back.
☪️ Halal certification needs to be front and centre. 34.5% of shoppers name it as their single most important factor, and for Malay respondents that rises to 50.7%. It is table stakes, but many local brands do not make it prominent enough in packaging and digital presence.
🏪 For retailers and platform marketers
Promotions are now the primary trial mechanism. 49.6% cited a promotion as a trial trigger, and 37.6% called it the most convincing single factor. The ROI case for promotional investment, especially for new product launches or brand restages, is backed by this data. Brands that have pulled back from promotions due to margin pressure are effectively opting out of the main discovery channel.
TikTok, Instagram, and Facebook are purchase-funnel tools, not just awareness plays. 34.6% of shoppers tried a new brand because they saw it on social media. For 18-24 year-olds it is nearly 1 in 2. If your brand's social presence does not include product-level activation with clear purchase calls to action, you are leaving trial on the table.
🔭 For strategic planning and research teams
The highest-value questions left unanswered here are (1) which specific brands are gaining versus losing within categories, and (2) whether the local-brand shift persists when economic pressure eases. A customized study in Q4 2026 or Q1 2027 would let you track whether this is a durable structural shift or a recessionary reflex. The category candidates with the most to learn: personal care and coffee.
Filter all 486 responses by demographic, category, and brand. See the numbers behind every finding in this report.
Note: The dashboard is best viewed on laptop or desktop.